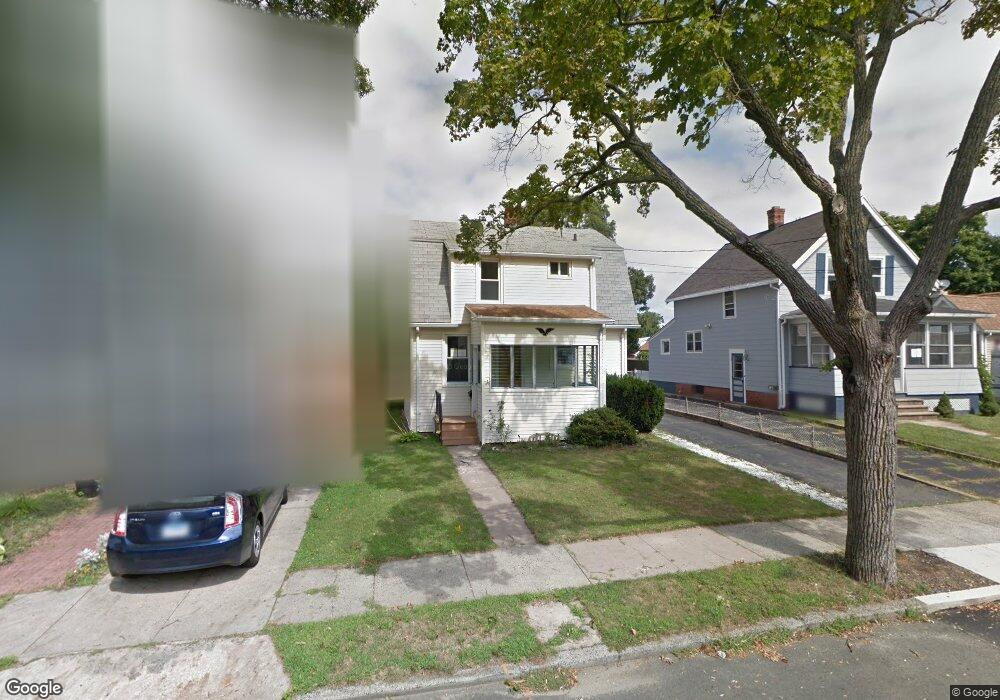
67 Marshall St West Haven, CT 06516
West Haven Center NeighborhoodEstimated Value: $294,688 - $367,000
3
Beds
2
Baths
1,308
Sq Ft
$248/Sq Ft
Est. Value
About This Home
This home is located at 67 Marshall St, West Haven, CT 06516 and is currently estimated at $324,422, approximately $248 per square foot. 67 Marshall St is a home located in New Haven County with nearby schools including Carrigan 5/6 Intermediate School, Harry M. Bailey Middle School, and West Haven High School.
Ownership History
Date
Name
Owned For
Owner Type
Purchase Details
Closed on
Dec 28, 2015
Sold by
Usa Va
Bought by
Chumpitaz Omar
Current Estimated Value
Home Financials for this Owner
Home Financials are based on the most recent Mortgage that was taken out on this home.
Original Mortgage
$75,605
Outstanding Balance
$60,189
Interest Rate
3.99%
Mortgage Type
FHA
Estimated Equity
$264,233
Purchase Details
Closed on
Jun 23, 2015
Sold by
Wells Fargo Bank Na
Bought by
Usa Va
Purchase Details
Closed on
Aug 3, 2007
Sold by
Crosby Joseph
Bought by
Theodis Wayne and Theodis Rimbareley
Create a Home Valuation Report for This Property
The Home Valuation Report is an in-depth analysis detailing your home's value as well as a comparison with similar homes in the area
Home Values in the Area
Average Home Value in this Area
Purchase History
| Date | Buyer | Sale Price | Title Company |
|---|---|---|---|
| Chumpitaz Omar | $77,000 | -- | |
| Usa Va | -- | -- | |
| Theodis Wayne | $190,000 | -- | |
| Chumpitaz Omar | $77,000 | -- | |
| Usa Va | -- | -- | |
| Theodis Wayne | $190,000 | -- |
Source: Public Records
Mortgage History
| Date | Status | Borrower | Loan Amount |
|---|---|---|---|
| Open | Theodis Wayne | $75,605 | |
| Closed | Theodis Wayne | $75,605 |
Source: Public Records
Tax History
| Year | Tax Paid | Tax Assessment Tax Assessment Total Assessment is a certain percentage of the fair market value that is determined by local assessors to be the total taxable value of land and additions on the property. | Land | Improvement |
|---|---|---|---|---|
| 2025 | $6,164 | $178,500 | $59,080 | $119,420 |
| 2024 | $5,461 | $112,560 | $40,880 | $71,680 |
| 2023 | $5,235 | $112,560 | $40,880 | $71,680 |
| 2022 | $5,133 | $112,560 | $40,880 | $71,680 |
| 2021 | $5,133 | $112,560 | $40,880 | $71,680 |
| 2020 | $5,109 | $101,220 | $32,900 | $68,320 |
| 2019 | $4,926 | $101,220 | $32,900 | $68,320 |
| 2018 | $4,884 | $101,220 | $32,900 | $68,320 |
| 2017 | $4,622 | $101,220 | $32,900 | $68,320 |
| 2016 | $4,612 | $101,220 | $32,900 | $68,320 |
| 2015 | $4,530 | $112,280 | $36,680 | $75,600 |
| 2014 | $4,502 | $112,280 | $36,680 | $75,600 |
Source: Public Records
Map
Nearby Homes
Your Personal Tour Guide
Ask me questions while you tour the home.