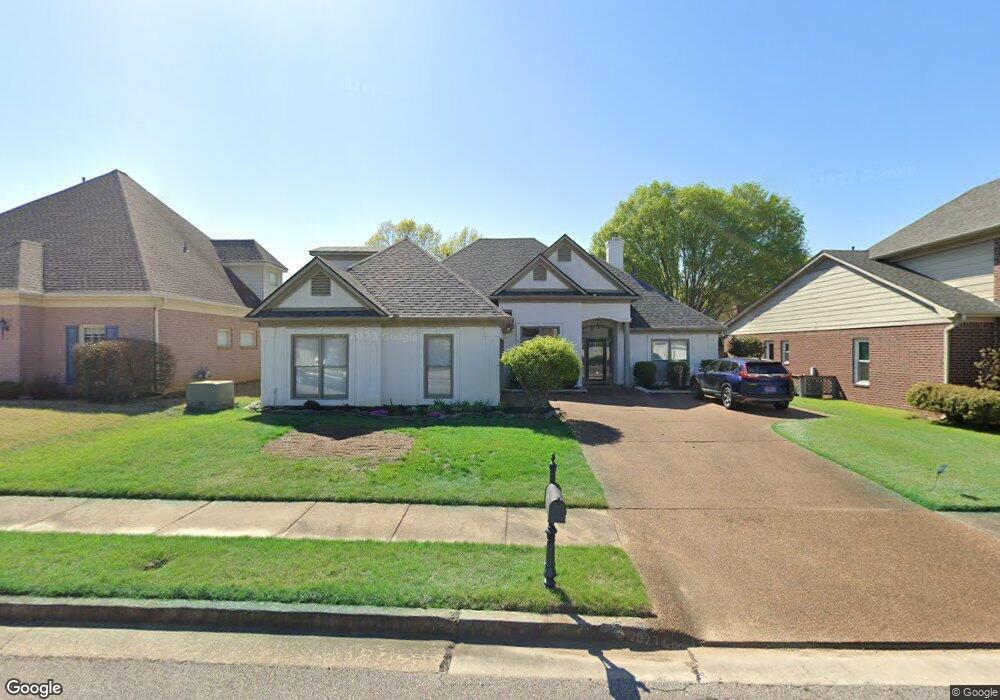
67 Morris Manor Dr Collierville, TN 38017
Estimated Value: $406,562 - $450,000
3
Beds
3
Baths
2,565
Sq Ft
$168/Sq Ft
Est. Value
About This Home
This home is located at 67 Morris Manor Dr, Collierville, TN 38017 and is currently estimated at $431,641, approximately $168 per square foot. 67 Morris Manor Dr is a home located in Shelby County with nearby schools including Bailey Station Elementary School, West Collierville Middle School, and Collierville High School.
Ownership History
Date
Name
Owned For
Owner Type
Purchase Details
Closed on
May 31, 2002
Sold by
Brummett John D and Brummett Jeanie L
Bought by
Shin Hyun Jae
Current Estimated Value
Home Financials for this Owner
Home Financials are based on the most recent Mortgage that was taken out on this home.
Original Mortgage
$186,200
Outstanding Balance
$77,409
Interest Rate
6.85%
Estimated Equity
$354,232
Purchase Details
Closed on
Aug 31, 2001
Sold by
Stewart Phillip C and Stewart Elizabeth
Bought by
Brummett John D and Brummett Jeanie L
Purchase Details
Closed on
Aug 23, 1999
Sold by
Morris Patrick W and Morris Tracey
Bought by
Stewart Philip C and Stewart Elizabeth
Home Financials for this Owner
Home Financials are based on the most recent Mortgage that was taken out on this home.
Original Mortgage
$219,900
Interest Rate
7.58%
Purchase Details
Closed on
Jun 4, 1996
Sold by
Steve Orians & Company Inc
Bought by
Morris Patrick Wayne and Morris Tracey
Create a Home Valuation Report for This Property
The Home Valuation Report is an in-depth analysis detailing your home's value as well as a comparison with similar homes in the area
Home Values in the Area
Average Home Value in this Area
Purchase History
| Date | Buyer | Sale Price | Title Company |
|---|---|---|---|
| Shin Hyun Jae | $206,900 | -- | |
| Brummett John D | $215,989 | Fayette County Title Company | |
| Brummett John D | $215,989 | Fayette County Title Company | |
| Stewart Philip C | $219,900 | Mid South Title | |
| Stewart Philip C | $219,900 | Mid South Title | |
| Morris Patrick Wayne | -- | Chicago Title Insurance Co | |
| Morris Patrick Wayne | -- | Chicago Title Insurance Co |
Source: Public Records
Mortgage History
| Date | Status | Borrower | Loan Amount |
|---|---|---|---|
| Open | Shin Hyun Jae | $186,200 | |
| Previous Owner | Stewart Philip C | $219,900 |
Source: Public Records
Tax History
| Year | Tax Paid | Tax Assessment Tax Assessment Total Assessment is a certain percentage of the fair market value that is determined by local assessors to be the total taxable value of land and additions on the property. | Land | Improvement |
|---|---|---|---|---|
| 2025 | $2,664 | $104,700 | $12,400 | $92,300 |
| 2024 | $2,664 | $78,575 | $12,400 | $66,175 |
| 2023 | $4,109 | $78,575 | $12,400 | $66,175 |
| 2022 | $4,015 | $78,575 | $12,400 | $66,175 |
| 2021 | $4,062 | $78,575 | $12,400 | $66,175 |
| 2020 | $3,582 | $60,925 | $12,400 | $48,525 |
| 2019 | $2,467 | $60,925 | $12,400 | $48,525 |
| 2018 | $2,467 | $60,925 | $12,400 | $48,525 |
| 2017 | $2,504 | $60,925 | $12,400 | $48,525 |
| 2016 | $2,406 | $55,050 | $0 | $0 |
| 2014 | $2,406 | $55,050 | $0 | $0 |
Source: Public Records
Map
Nearby Homes
- 202 Chadwick Woods Ln
- 1701 Village Ridge Place
- 136 Garner Grove Cove
- 1730 Gosnold Bluff Rd
- 1740 Constable Ct
- 1853 Northcross Place S
- 1727 Village Ridge Rd
- 1707 Wainwright Ct
- 1685 Jennings Mill Ln W
- 340 Dogwood Valley Dr
- 1837 Northcross Place N
- 1664 Poppy Hills Dr
- 166 Ivy Brook Ln
- 1423 Calumet Farms Dr Unit 36
- 1421 Peyton Run Loop S
- 219 Northcross Place W
- 190 Ivy Brook Ln
- 20 Peyton Ridge Cove Unit BLDG7
- 1139 Oak Heights Ln Unit 109
- 405 Catawba Valley Dr
- 75 Morris Manor Dr
- 61 Morris Manor Dr
- 68 S Mccall Cove
- 1715 von Hall Dr
- 76 Mccall Dr
- 60 S Mccall Cove
- 1714 Goldsmith Ct
- 51 Morris Manor Dr
- 85 Morris Manor Dr
- 52 S Mccall Cove
- 1709 von Hall Dr
- 1708 Goldsmith Ct
- 88 Mccall Dr
- 86 Morris Manor Dr
- 1715 Goldsmith Ct
- 73 Mccall Dr
- 59 S Mccall Cove
- 1701 von Hall Dr
- 1702 Goldsmith Ct
- 48 S Mccall Cove
Your Personal Tour Guide
Ask me questions while you tour the home.