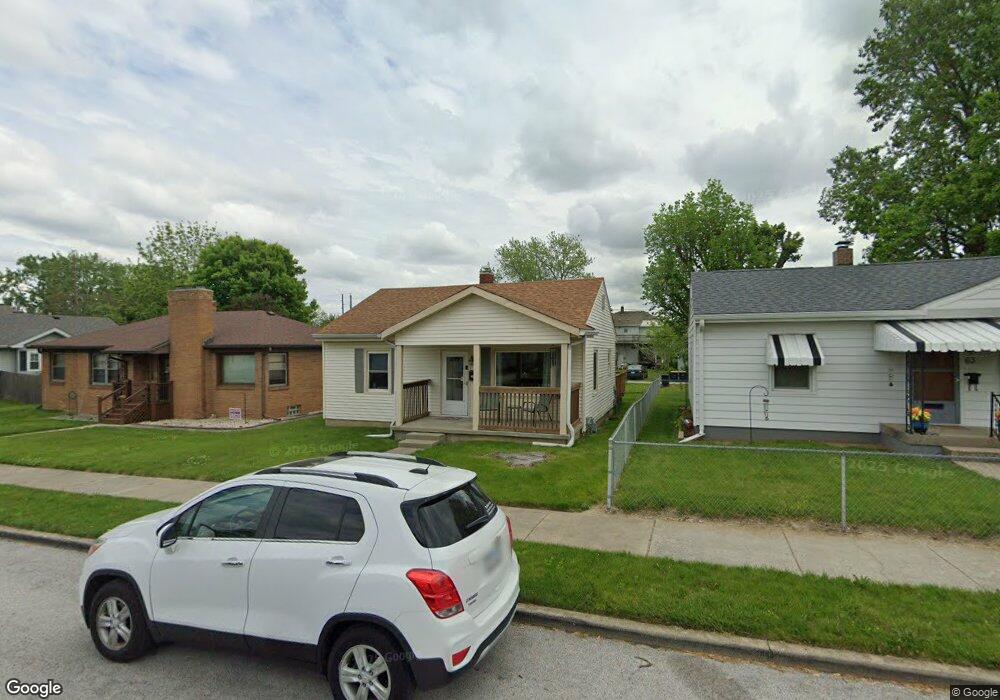
67 N 8th Ave Beech Grove, IN 46107
Estimated Value: $145,612 - $173,000
2
Beds
1
Bath
1,440
Sq Ft
$108/Sq Ft
Est. Value
About This Home
This home is located at 67 N 8th Ave, Beech Grove, IN 46107 and is currently estimated at $155,903, approximately $108 per square foot. 67 N 8th Ave is a home located in Marion County with nearby schools including Hornet Park Elementary School, Central Elementary School, and South Grove Intermediate School.
Ownership History
Date
Name
Owned For
Owner Type
Purchase Details
Closed on
Jul 15, 2015
Sold by
Secretary Of Housing & Urban Development
Bought by
Wells Fargo Bank Na
Current Estimated Value
Purchase Details
Closed on
May 1, 2015
Sold by
Wells Fargo Bank Na
Bought by
Henthorn Kris R and Henthorn Pamela J
Purchase Details
Closed on
Feb 27, 2015
Sold by
Wells Fargo Bank Na
Bought by
Secretary Of Housing & Urban Development
Purchase Details
Closed on
Feb 23, 2015
Sold by
Shade Mark R
Bought by
Wells Fargo Bank Na
Purchase Details
Closed on
Jul 6, 2006
Sold by
Secretary Of Housing & Urban Development
Bought by
Shade Mark R
Home Financials for this Owner
Home Financials are based on the most recent Mortgage that was taken out on this home.
Original Mortgage
$52,250
Interest Rate
6.72%
Mortgage Type
FHA
Purchase Details
Closed on
Mar 28, 2006
Sold by
Midfirst Bank
Bought by
Secretary Of Hud
Create a Home Valuation Report for This Property
The Home Valuation Report is an in-depth analysis detailing your home's value as well as a comparison with similar homes in the area
Home Values in the Area
Average Home Value in this Area
Purchase History
| Date | Buyer | Sale Price | Title Company |
|---|---|---|---|
| Wells Fargo Bank Na | -- | Attorney | |
| Henthorn Kris R | $44,850 | None Available | |
| Secretary Of Housing & Urban Development | -- | None Available | |
| Wells Fargo Bank Na | $54,600 | None Available | |
| Shade Mark R | -- | Village Title Inc | |
| Secretary Of Hud | -- | None Available | |
| Midfirst Bank | $102,198 | None Available |
Source: Public Records
Mortgage History
| Date | Status | Borrower | Loan Amount |
|---|---|---|---|
| Previous Owner | Shade Mark R | $52,250 |
Source: Public Records
Tax History Compared to Growth
Tax History
| Year | Tax Paid | Tax Assessment Tax Assessment Total Assessment is a certain percentage of the fair market value that is determined by local assessors to be the total taxable value of land and additions on the property. | Land | Improvement |
|---|---|---|---|---|
| 2024 | $2,937 | $117,600 | $17,000 | $100,600 |
| 2023 | $2,937 | $105,300 | $17,000 | $88,300 |
| 2022 | $2,793 | $97,600 | $17,000 | $80,600 |
| 2021 | $2,316 | $83,600 | $17,000 | $66,600 |
| 2020 | $1,971 | $75,700 | $17,000 | $58,700 |
| 2019 | $1,814 | $72,300 | $14,000 | $58,300 |
| 2018 | $1,604 | $66,200 | $14,000 | $52,200 |
| 2017 | $1,625 | $64,900 | $14,000 | $50,900 |
| 2016 | $1,564 | $63,100 | $14,000 | $49,100 |
| 2014 | $1,344 | $57,600 | $14,000 | $43,600 |
| 2013 | $512 | $51,700 | $14,000 | $37,700 |
Source: Public Records
Map
Nearby Homes