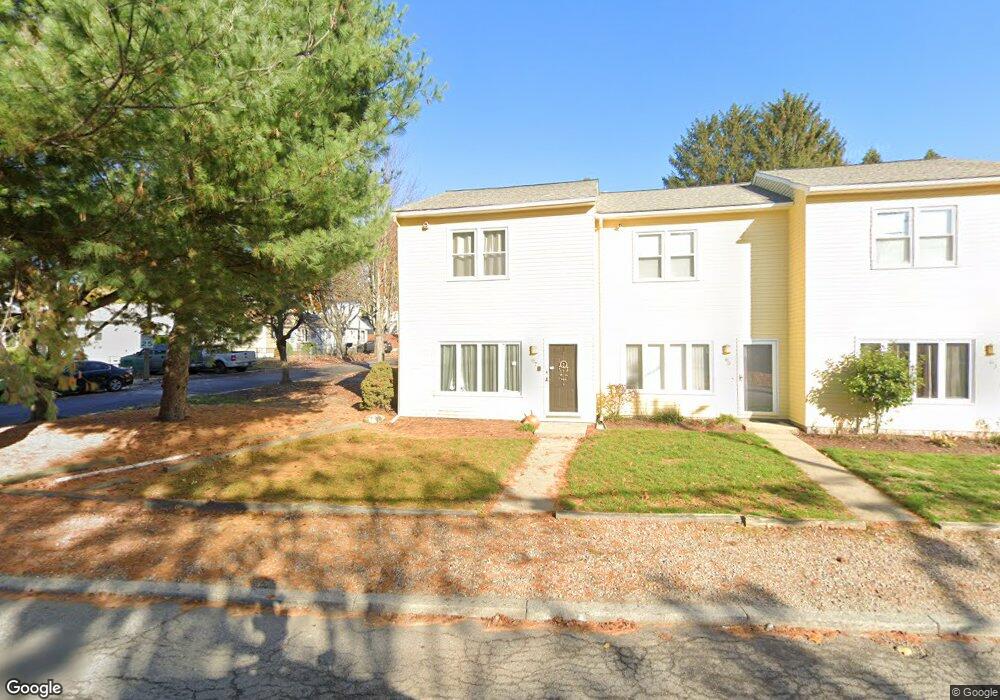
67 Northup Ave Unit 4 Providence, RI 02904
Charles NeighborhoodEstimated Value: $255,215 - $287,000
2
Beds
2
Baths
1,020
Sq Ft
$268/Sq Ft
Est. Value
About This Home
This home is located at 67 Northup Ave Unit 4, Providence, RI 02904 and is currently estimated at $273,304, approximately $267 per square foot. 67 Northup Ave Unit 4 is a home located in Providence County with nearby schools including Asa Messer Elementary School, Charles N. Fortes Elementary School, and Veazie Street Elementary School.
Ownership History
Date
Name
Owned For
Owner Type
Purchase Details
Closed on
Sep 18, 1998
Sold by
Yardley Group Inc
Bought by
Goldberg Allan D and Goldberg Gabriela A
Current Estimated Value
Create a Home Valuation Report for This Property
The Home Valuation Report is an in-depth analysis detailing your home's value as well as a comparison with similar homes in the area
Home Values in the Area
Average Home Value in this Area
Purchase History
| Date | Buyer | Sale Price | Title Company |
|---|---|---|---|
| Goldberg Allan D | $30,000 | -- |
Source: Public Records
Tax History Compared to Growth
Tax History
| Year | Tax Paid | Tax Assessment Tax Assessment Total Assessment is a certain percentage of the fair market value that is determined by local assessors to be the total taxable value of land and additions on the property. | Land | Improvement |
|---|---|---|---|---|
| 2025 | $4,044 | $277,000 | $0 | $277,000 |
| 2024 | $3,558 | $193,900 | $0 | $193,900 |
| 2023 | $3,558 | $193,900 | $0 | $193,900 |
| 2022 | $3,451 | $193,900 | $0 | $193,900 |
| 2021 | $2,164 | $88,100 | $0 | $88,100 |
| 2020 | $2,164 | $88,100 | $0 | $88,100 |
| 2019 | $2,164 | $88,100 | $0 | $88,100 |
| 2018 | $3,100 | $97,000 | $0 | $97,000 |
| 2017 | $3,100 | $97,000 | $0 | $97,000 |
| 2016 | $3,100 | $97,000 | $0 | $97,000 |
| 2015 | $3,042 | $91,900 | $0 | $91,900 |
| 2014 | $3,102 | $91,900 | $0 | $91,900 |
| 2013 | $3,102 | $91,900 | $0 | $91,900 |
Source: Public Records
Map
Nearby Homes
- 67 Northup Ave Unit 7
- 67 Northup Ave Unit 3
- 67 Northup Ave Unit 1
- 67 Northup Ave Unit 2
- 67 Northup Ave Unit 6
- 59 Northup Ave
- 67 Northup Ave Unit 55
- 59 Northup Ave Unit 5
- 61 Northrup Ave Unit 4
- 61 Northrup Ave
- 61 Northrup Ave Unit 61
- 59 Northrup Ave Unit 5
- 59 Northrup Ave Unit 59
- 63 Northrup Ave Unit 63
- 63 Northrup Ave Unit 3
- 57 Northup Ave Unit 6
- 57 Northup Ave Unit 57
- 55 Northrup Ave Unit 55
- 65 Northrup Ave Unit 2
- 55 Northup Ave