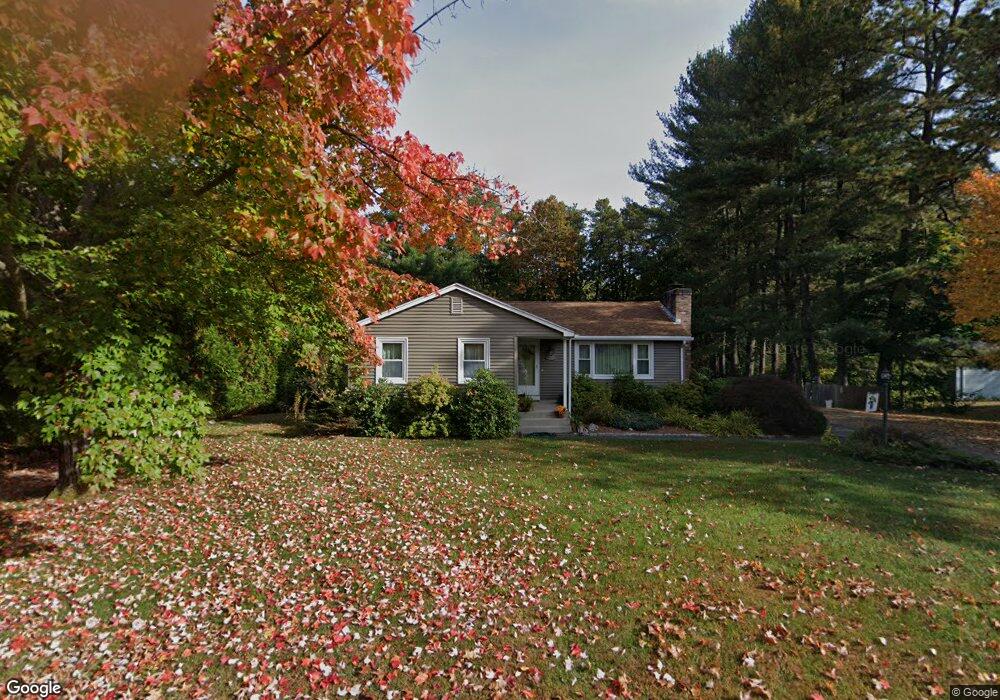
67 Phelps St Easthampton, MA 01027
Estimated Value: $369,000 - $411,352
3
Beds
3
Baths
1,212
Sq Ft
$318/Sq Ft
Est. Value
About This Home
This home is located at 67 Phelps St, Easthampton, MA 01027 and is currently estimated at $385,838, approximately $318 per square foot. 67 Phelps St is a home located in Hampshire County with nearby schools including Easthampton High School, Calvary Baptist Christian School, and Tri-County Schools.
Ownership History
Date
Name
Owned For
Owner Type
Purchase Details
Closed on
Nov 25, 1994
Sold by
Ducharme Dora A and Ducharme Robert E
Bought by
Corbeil-Harper Joanne and Harper Scott A
Current Estimated Value
Create a Home Valuation Report for This Property
The Home Valuation Report is an in-depth analysis detailing your home's value as well as a comparison with similar homes in the area
Home Values in the Area
Average Home Value in this Area
Purchase History
| Date | Buyer | Sale Price | Title Company |
|---|---|---|---|
| Corbeil-Harper Joanne | $115,000 | -- |
Source: Public Records
Mortgage History
| Date | Status | Borrower | Loan Amount |
|---|---|---|---|
| Open | Corbeil-Harper Joanne | $68,000 | |
| Closed | Corbeil-Harper Joanne | $30,000 | |
| Closed | Corbeil-Harper Joanne | $72,000 | |
| Closed | Corbeil-Harper Joanne | $17,500 |
Source: Public Records
Tax History
| Year | Tax Paid | Tax Assessment Tax Assessment Total Assessment is a certain percentage of the fair market value that is determined by local assessors to be the total taxable value of land and additions on the property. | Land | Improvement |
|---|---|---|---|---|
| 2025 | $4,823 | $352,800 | $120,400 | $232,400 |
| 2024 | $4,659 | $343,600 | $117,000 | $226,600 |
| 2023 | $3,557 | $242,800 | $91,800 | $151,000 |
| 2022 | $4,013 | $242,800 | $91,800 | $151,000 |
| 2021 | $4,387 | $250,100 | $91,800 | $158,300 |
| 2020 | $4,312 | $242,800 | $91,800 | $151,000 |
| 2019 | $3,619 | $234,100 | $91,800 | $142,300 |
| 2018 | $3,477 | $217,300 | $86,600 | $130,700 |
| 2017 | $3,399 | $209,700 | $83,400 | $126,300 |
| 2016 | $3,383 | $217,000 | $83,400 | $133,600 |
| 2015 | $3,288 | $217,000 | $83,400 | $133,600 |
Source: Public Records
Map
Nearby Homes
Your Personal Tour Guide
Ask me questions while you tour the home.