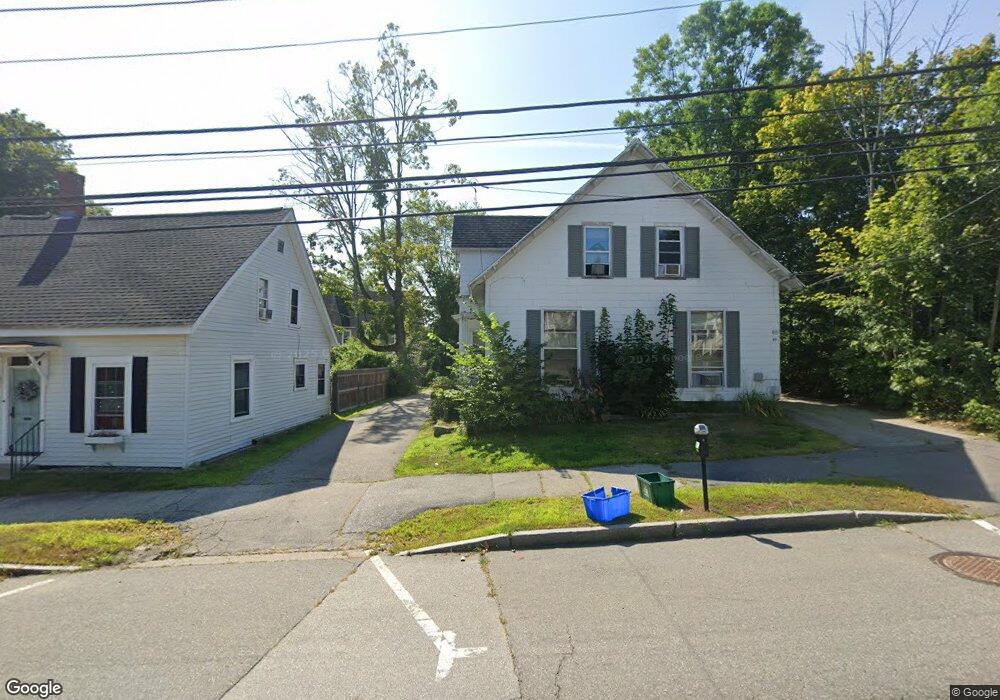
67 Pleasant St Unit 69 Concord, NH 03301
South End NeighborhoodEstimated Value: $403,053 - $582,000
8
Beds
4
Baths
3,125
Sq Ft
$160/Sq Ft
Est. Value
About This Home
This home is located at 67 Pleasant St Unit 69, Concord, NH 03301 and is currently estimated at $500,013, approximately $160 per square foot. 67 Pleasant St Unit 69 is a home located in Merrimack County with nearby schools including Christa McAuliffe School, Rundlett Middle School, and Concord High School.
Ownership History
Date
Name
Owned For
Owner Type
Purchase Details
Closed on
Mar 20, 2014
Sold by
Wageling Kurt
Bought by
Danbe Realty Llc
Current Estimated Value
Purchase Details
Closed on
Jan 27, 2014
Sold by
Wells Fargo Bank Na Tr
Bought by
Wageling Kurt
Purchase Details
Closed on
Aug 13, 2013
Sold by
Wentworth David A
Bought by
Wells Fargo Bank Na Tr
Purchase Details
Closed on
Aug 1, 1997
Sold by
Guertin Gene A
Bought by
Wentworth David A and Wentworth Joanne K
Home Financials for this Owner
Home Financials are based on the most recent Mortgage that was taken out on this home.
Original Mortgage
$91,411
Interest Rate
7.55%
Mortgage Type
Purchase Money Mortgage
Create a Home Valuation Report for This Property
The Home Valuation Report is an in-depth analysis detailing your home's value as well as a comparison with similar homes in the area
Home Values in the Area
Average Home Value in this Area
Purchase History
| Date | Buyer | Sale Price | Title Company |
|---|---|---|---|
| Danbe Realty Llc | $200,000 | -- | |
| Danbe Realty Llc | $200,000 | -- | |
| Wageling Kurt | $149,700 | -- | |
| Wageling Kurt | $149,700 | -- | |
| Wells Fargo Bank Na Tr | $170,000 | -- | |
| Wells Fargo Bank Na Tr | $170,000 | -- | |
| Wentworth David A | $93,800 | -- | |
| Wentworth David A | $93,800 | -- |
Source: Public Records
Mortgage History
| Date | Status | Borrower | Loan Amount |
|---|---|---|---|
| Previous Owner | Wentworth David A | $91,411 | |
| Closed | Wentworth David A | $0 |
Source: Public Records
Tax History Compared to Growth
Tax History
| Year | Tax Paid | Tax Assessment Tax Assessment Total Assessment is a certain percentage of the fair market value that is determined by local assessors to be the total taxable value of land and additions on the property. | Land | Improvement |
|---|---|---|---|---|
| 2024 | $9,226 | $333,200 | $100,000 | $233,200 |
| 2023 | $8,950 | $333,200 | $100,000 | $233,200 |
| 2022 | $8,627 | $333,200 | $100,000 | $233,200 |
| 2021 | $9,242 | $367,900 | $100,000 | $267,900 |
| 2020 | $8,304 | $310,300 | $79,900 | $230,400 |
| 2019 | $7,742 | $278,700 | $76,200 | $202,500 |
| 2018 | $7,259 | $257,500 | $73,200 | $184,300 |
| 2017 | $5,792 | $205,100 | $73,200 | $131,900 |
| 2016 | $5,512 | $199,200 | $73,200 | $126,000 |
| 2015 | $5,126 | $187,500 | $71,700 | $115,800 |
| 2014 | $5,027 | $187,500 | $71,700 | $115,800 |
| 2013 | -- | $189,500 | $71,700 | $117,800 |
| 2012 | $4,326 | $177,500 | $71,700 | $105,800 |
Source: Public Records
Map
Nearby Homes
- 54 Pleasant St Unit 8
- 25 Fayette St
- 47 South St
- 4 Fayette St
- 17 Essex St
- 75 S State St
- 14-16 Perley St
- 14 Downing St
- 10 Perley St
- 12 Avon St
- 87 S Main St Unit 2
- 0 Spruce St Unit 88
- 33 Spruce St
- 2 Kensington Rd
- 24 Badger St
- 122 South St
- 1 Kensington Rd
- 30 Jackson St
- 105 S Main St
- 0 South St Unit 4969509