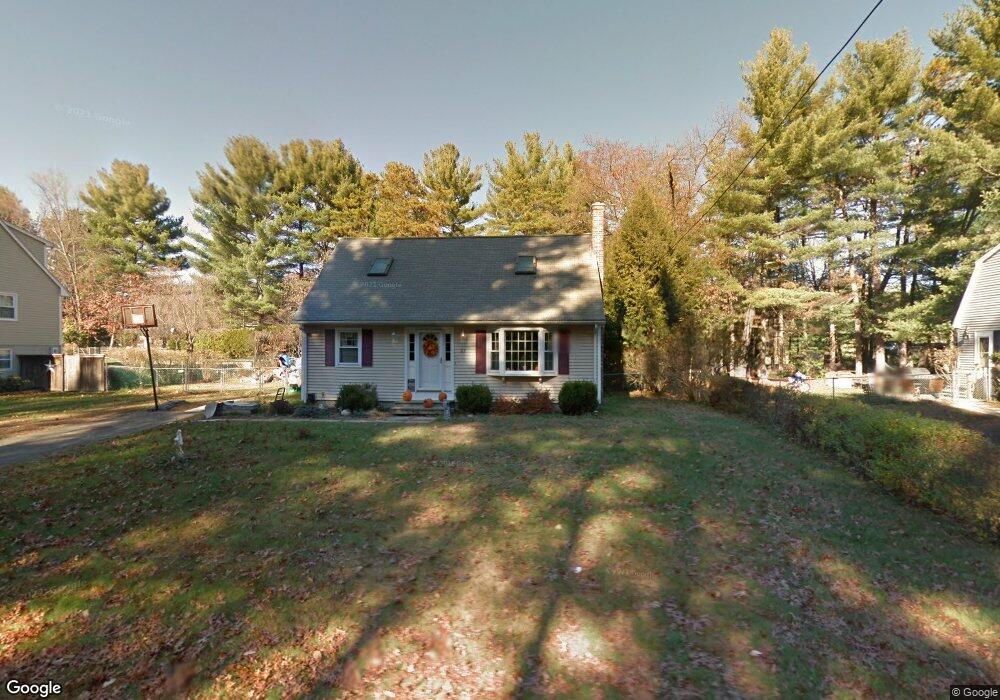
67 Pomeroy St Easthampton, MA 01027
Estimated Value: $389,000 - $467,000
3
Beds
3
Baths
1,469
Sq Ft
$298/Sq Ft
Est. Value
About This Home
This home is located at 67 Pomeroy St, Easthampton, MA 01027 and is currently estimated at $437,776, approximately $298 per square foot. 67 Pomeroy St is a home located in Hampshire County with nearby schools including Easthampton High School, Calvary Baptist Christian School, and Tri-County Schools.
Ownership History
Date
Name
Owned For
Owner Type
Purchase Details
Closed on
Jun 1, 1992
Sold by
Kline Russell E and Kline Margaret C
Bought by
Bernier Louis R and Corcoran Noreen E
Current Estimated Value
Home Financials for this Owner
Home Financials are based on the most recent Mortgage that was taken out on this home.
Original Mortgage
$112,800
Interest Rate
8.7%
Mortgage Type
Purchase Money Mortgage
Create a Home Valuation Report for This Property
The Home Valuation Report is an in-depth analysis detailing your home's value as well as a comparison with similar homes in the area
Home Values in the Area
Average Home Value in this Area
Purchase History
| Date | Buyer | Sale Price | Title Company |
|---|---|---|---|
| Bernier Louis R | $123,000 | -- |
Source: Public Records
Mortgage History
| Date | Status | Borrower | Loan Amount |
|---|---|---|---|
| Open | Bernier Louis R | $101,000 | |
| Closed | Bernier Louis R | $112,800 |
Source: Public Records
Tax History
| Year | Tax Paid | Tax Assessment Tax Assessment Total Assessment is a certain percentage of the fair market value that is determined by local assessors to be the total taxable value of land and additions on the property. | Land | Improvement |
|---|---|---|---|---|
| 2025 | $5,166 | $377,900 | $107,600 | $270,300 |
| 2024 | $4,987 | $367,800 | $104,400 | $263,400 |
| 2023 | $3,728 | $254,500 | $82,200 | $172,300 |
| 2022 | $4,207 | $254,500 | $82,200 | $172,300 |
| 2021 | $4,645 | $264,800 | $82,200 | $182,600 |
| 2020 | $4,520 | $254,500 | $82,200 | $172,300 |
| 2019 | $3,338 | $215,900 | $82,200 | $133,700 |
| 2018 | $3,222 | $201,400 | $77,600 | $123,800 |
| 2017 | $3,148 | $194,200 | $74,600 | $119,600 |
| 2016 | $3,300 | $211,700 | $74,600 | $137,100 |
| 2015 | $3,207 | $211,700 | $74,600 | $137,100 |
Source: Public Records
Map
Nearby Homes
Your Personal Tour Guide
Ask me questions while you tour the home.