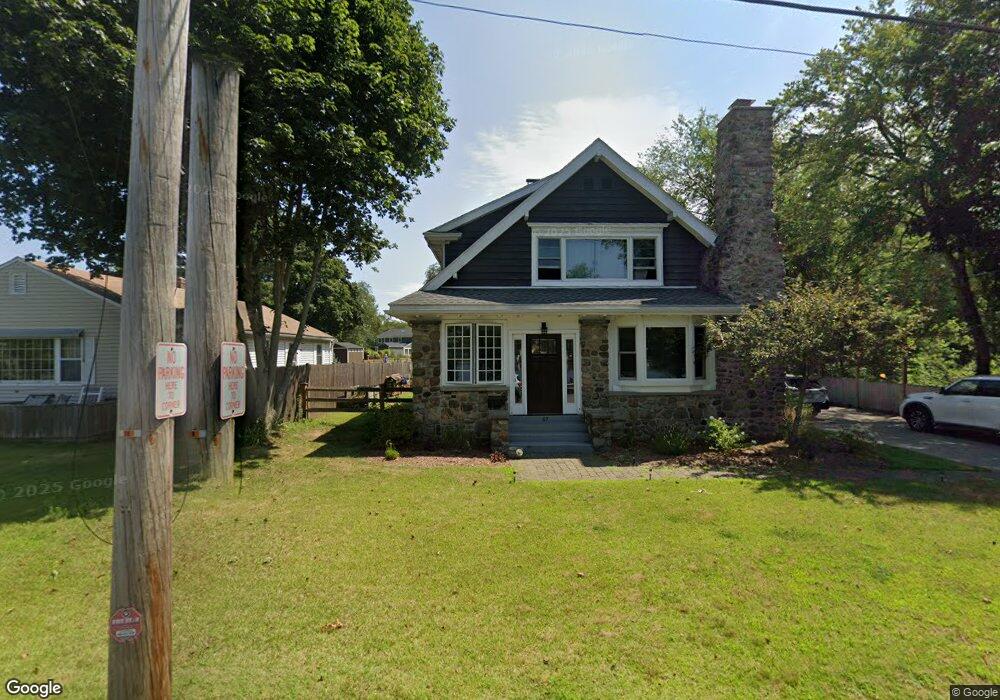
67 Pond St Georgetown, MA 01833
Estimated Value: $556,000 - $716,000
3
Beds
2
Baths
1,654
Sq Ft
$393/Sq Ft
Est. Value
About This Home
This home is located at 67 Pond St, Georgetown, MA 01833 and is currently estimated at $649,532, approximately $392 per square foot. 67 Pond St is a home located in Essex County with nearby schools including Perley Elementary School, Penn Brook School, and Georgetown High School.
Ownership History
Date
Name
Owned For
Owner Type
Purchase Details
Closed on
Sep 3, 2024
Sold by
Van Margaret F and Van Galen
Bought by
Vangalen Marcel J and Vangalen Van Galen
Current Estimated Value
Purchase Details
Closed on
Jul 10, 2023
Sold by
Vangalen Marcel J and Vangalen Van Galen
Bought by
Van Margaret F and Van Galen
Purchase Details
Closed on
Jul 30, 2008
Sold by
Rich Daniel F and Rich Jacinda R
Bought by
Vangalen Marcel J and Vangalen Margaret F
Purchase Details
Closed on
Jun 11, 2004
Sold by
Ainsley Cynthia J and Ainsley John F
Bought by
Rich Daniel F
Purchase Details
Closed on
Jul 31, 1995
Sold by
Pucci Stephen C and Pucci Jeanne
Bought by
Ainsley John F and Ainsley Cynthia
Create a Home Valuation Report for This Property
The Home Valuation Report is an in-depth analysis detailing your home's value as well as a comparison with similar homes in the area
Home Values in the Area
Average Home Value in this Area
Purchase History
| Date | Buyer | Sale Price | Title Company |
|---|---|---|---|
| Vangalen Marcel J | -- | None Available | |
| Vangalen Marcel J | -- | None Available | |
| Van Margaret F | -- | None Available | |
| Van Margaret F | -- | None Available | |
| Van Margaret F | -- | None Available | |
| Vangalen Marcel J | $372,500 | -- | |
| Rich Daniel F | $357,500 | -- | |
| Ainsley John F | $173,500 | -- | |
| Vangalen Marcel J | $372,500 | -- | |
| Rich Daniel F | $357,500 | -- | |
| Ainsley John F | $173,500 | -- |
Source: Public Records
Mortgage History
| Date | Status | Borrower | Loan Amount |
|---|---|---|---|
| Previous Owner | Ainsley John F | $372,245 |
Source: Public Records
Tax History
| Year | Tax Paid | Tax Assessment Tax Assessment Total Assessment is a certain percentage of the fair market value that is determined by local assessors to be the total taxable value of land and additions on the property. | Land | Improvement |
|---|---|---|---|---|
| 2025 | $7,631 | $690,000 | $318,100 | $371,900 |
| 2024 | $6,595 | $525,500 | $219,400 | $306,100 |
| 2023 | $6,766 | $521,300 | $219,400 | $301,900 |
| 2022 | $6,937 | $492,700 | $190,800 | $301,900 |
| 2021 | $6,027 | $379,300 | $190,800 | $188,500 |
| 2020 | $6,038 | $379,300 | $190,800 | $188,500 |
| 2019 | $5,791 | $367,000 | $187,100 | $179,900 |
| 2018 | $5,828 | $367,000 | $187,100 | $179,900 |
| 2017 | $5,837 | $360,100 | $187,100 | $173,000 |
| 2016 | $5,388 | $339,500 | $187,100 | $152,400 |
| 2015 | $5,344 | $333,400 | $187,100 | $146,300 |
| 2014 | $4,684 | $333,400 | $187,100 | $146,300 |
Source: Public Records
Map
Nearby Homes
Your Personal Tour Guide
Ask me questions while you tour the home.