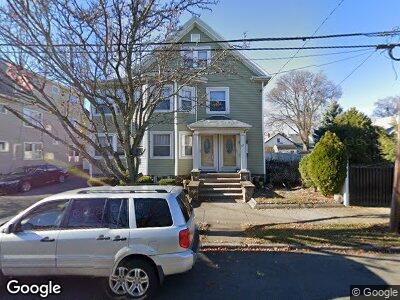
67 Rand St Lynn, MA 01904
Agganis AC NeighborhoodEstimated Value: $802,514 - $1,073,000
4
Beds
2
Baths
3,097
Sq Ft
$296/Sq Ft
Est. Value
About This Home
This home is located at 67 Rand St, Lynn, MA 01904 and is currently estimated at $915,379, approximately $295 per square foot. 67 Rand St is a home located in Essex County with nearby schools including Edward A. Sisson Elementary School, William R. Fallon School, and Pickering Middle School.
Ownership History
Date
Name
Owned For
Owner Type
Purchase Details
Closed on
Jul 3, 2006
Sold by
Touch Mao
Bought by
Touch Kosar and Vann Voleak
Current Estimated Value
Home Financials for this Owner
Home Financials are based on the most recent Mortgage that was taken out on this home.
Original Mortgage
$200,000
Interest Rate
6.58%
Mortgage Type
Purchase Money Mortgage
Purchase Details
Closed on
Jul 6, 2004
Sold by
Touch Mao and Meas Nhak
Bought by
Touch Mao
Purchase Details
Closed on
May 3, 2004
Sold by
Touch Mao
Bought by
Touch Mao
Home Financials for this Owner
Home Financials are based on the most recent Mortgage that was taken out on this home.
Original Mortgage
$100,000
Interest Rate
5.36%
Mortgage Type
Purchase Money Mortgage
Purchase Details
Closed on
Jul 30, 1999
Sold by
Lowry Thomas P
Bought by
Touch Mao
Create a Home Valuation Report for This Property
The Home Valuation Report is an in-depth analysis detailing your home's value as well as a comparison with similar homes in the area
Home Values in the Area
Average Home Value in this Area
Purchase History
| Date | Buyer | Sale Price | Title Company |
|---|---|---|---|
| Touch Kosar | $250,000 | -- | |
| Touch Mao | -- | -- | |
| Touch Mao | -- | -- | |
| Touch Mao | $195,500 | -- |
Source: Public Records
Mortgage History
| Date | Status | Borrower | Loan Amount |
|---|---|---|---|
| Open | Touch Mona | $180,000 | |
| Closed | Oshea Edmund J | $201,000 | |
| Closed | Oshea Edmund J | $200,000 | |
| Previous Owner | Oshea Edmund J | $100,000 |
Source: Public Records
Tax History Compared to Growth
Tax History
| Year | Tax Paid | Tax Assessment Tax Assessment Total Assessment is a certain percentage of the fair market value that is determined by local assessors to be the total taxable value of land and additions on the property. | Land | Improvement |
|---|---|---|---|---|
| 2025 | $8,518 | $822,238 | $197,500 | $624,738 |
| 2024 | $8,124 | $771,500 | $193,100 | $578,400 |
| 2023 | $8,024 | $719,600 | $181,500 | $538,100 |
| 2022 | $7,985 | $642,400 | $142,700 | $499,700 |
| 2021 | $7,688 | $590,000 | $144,500 | $445,500 |
| 2020 | $7,060 | $526,900 | $130,200 | $396,700 |
| 2019 | $6,848 | $478,900 | $122,600 | $356,300 |
| 2018 | $6,289 | $415,100 | $114,200 | $300,900 |
| 2017 | $5,997 | $384,400 | $100,800 | $283,600 |
| 2016 | $5,569 | $344,200 | $93,200 | $251,000 |
| 2015 | $5,399 | $322,300 | $99,000 | $223,300 |
Source: Public Records
Map
Nearby Homes
- 52 Locust St
- 29 Rand St
- 35 Linden Terrace
- 259 Western Ave
- 196 Locust St Unit 2-407
- 198 Locust St Unit 608
- 501 Chestnut St
- 58 Grant St
- 451 Broadway
- 199 Allen Ave
- 58 Beacon Hill Ct
- 39-41 Rock Ave
- 55 Winthrop St
- 29 Northern Ave
- 21 Blanchard St
- 6 Bay View Ave
- 1 1/2 Forest Hill Ave
- 10 Lake View Place
- 404 Broadway Unit 208
- 125 Pine Grove Ave