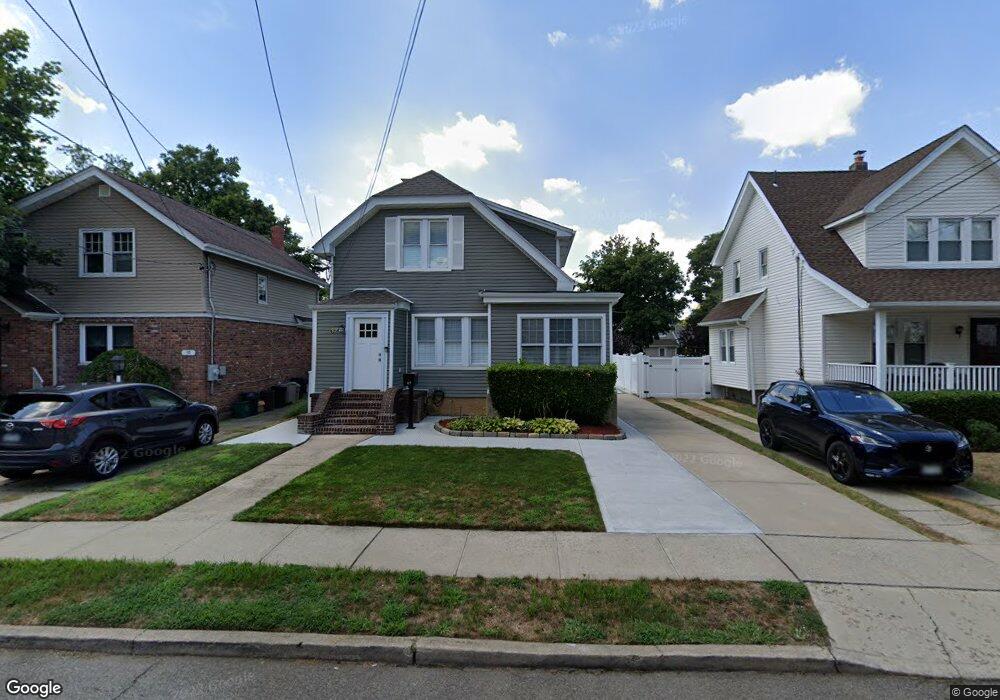
67 Rolling St Lynbrook, NY 11563
Estimated Value: $691,000 - $712,091
3
Beds
2
Baths
1,083
Sq Ft
$648/Sq Ft
Est. Value
About This Home
This home is located at 67 Rolling St, Lynbrook, NY 11563 and is currently estimated at $701,546, approximately $647 per square foot. 67 Rolling St is a home located in Nassau County with nearby schools including Davison Avenue Intermediate School, Maurice W. Downing Primary K-2 School, and Howard T Herber Middle School.
Ownership History
Date
Name
Owned For
Owner Type
Purchase Details
Closed on
Jan 19, 2021
Sold by
Heinze Ronnie Helene Hoffman
Bought by
Gonzales David and Dungca Gonzales Joan
Current Estimated Value
Home Financials for this Owner
Home Financials are based on the most recent Mortgage that was taken out on this home.
Original Mortgage
$376,000
Interest Rate
2.6%
Mortgage Type
New Conventional
Create a Home Valuation Report for This Property
The Home Valuation Report is an in-depth analysis detailing your home's value as well as a comparison with similar homes in the area
Home Values in the Area
Average Home Value in this Area
Purchase History
| Date | Buyer | Sale Price | Title Company |
|---|---|---|---|
| Gonzales David | $470,000 | None Available |
Source: Public Records
Mortgage History
| Date | Status | Borrower | Loan Amount |
|---|---|---|---|
| Previous Owner | Gonzales David | $376,000 |
Source: Public Records
Tax History
| Year | Tax Paid | Tax Assessment Tax Assessment Total Assessment is a certain percentage of the fair market value that is determined by local assessors to be the total taxable value of land and additions on the property. | Land | Improvement |
|---|---|---|---|---|
| 2025 | $9,321 | $428 | $180 | $248 |
| 2024 | $902 | $428 | $180 | $248 |
Source: Public Records
Map
Nearby Homes
- 58 Chestnut St
- 137 Charles St
- 25 Centre St
- 42 Driving Park Ave
- 367 Vincent Ave
- 45 Lynbrook Ave
- 266 Earle Ave
- 21 Washington Ave
- 157 Hempstead Ave Unit B20
- 212 Lakeview Ave
- 63 Central Ave
- 30 York St
- 60 Hempstead Ave Unit 1K
- 60 Hempstead Ave Unit 1J
- 75 Noble St Unit 126
- 75 Noble St Unit 121
- 90 Pearsall Ave
- 17 Oxford St
- 40 Daley Place Unit 124
- 40 Daley Place Unit 227
Your Personal Tour Guide
Ask me questions while you tour the home.