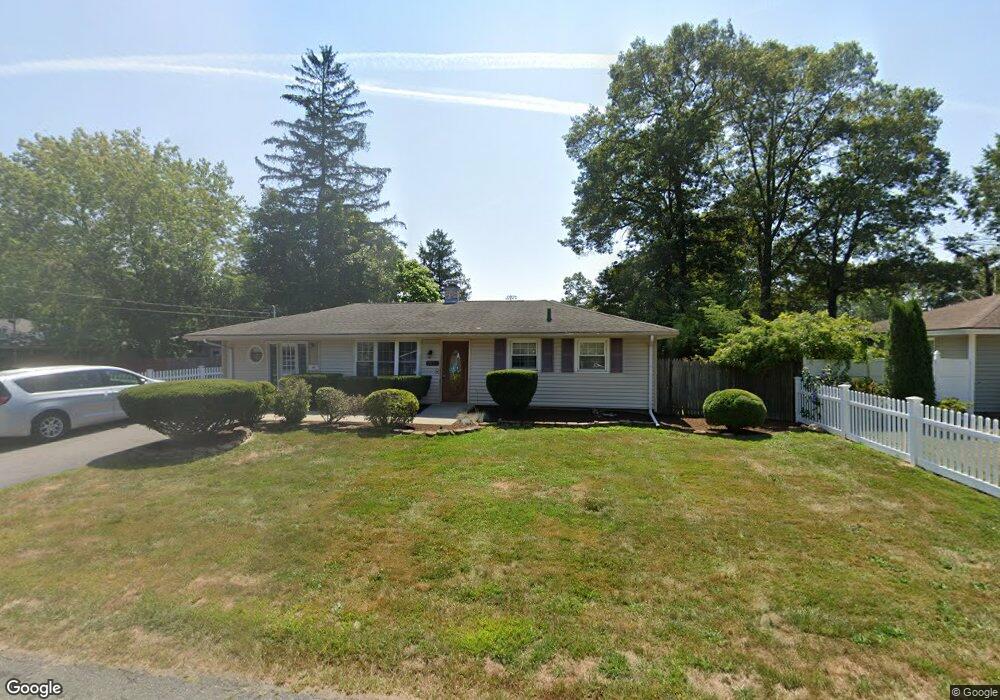
67 Ruth Rd Brockton, MA 02302
Estimated Value: $422,112
5
Beds
2
Baths
1,748
Sq Ft
$241/Sq Ft
Est. Value
About This Home
This home is located at 67 Ruth Rd, Brockton, MA 02302 and is currently estimated at $422,112, approximately $241 per square foot. 67 Ruth Rd is a home located in Plymouth County with nearby schools including Brookfield Elementary School, Mary E. Baker Elementary School, and Downey Elementary School.
Ownership History
Date
Name
Owned For
Owner Type
Purchase Details
Closed on
Aug 24, 2009
Sold by
Rodriguez Eugenio and Curet Grisel
Bought by
Growthways Inc
Current Estimated Value
Purchase Details
Closed on
Nov 30, 2004
Sold by
Turner Michael F
Bought by
Rodriguez Eugenio and Curet Grisel
Purchase Details
Closed on
Mar 1, 2002
Sold by
Turner Leiana J
Bought by
Turner Michael F
Purchase Details
Closed on
May 29, 1998
Sold by
Aheron Alan K
Bought by
Turner Leiana J
Purchase Details
Closed on
Feb 10, 1997
Sold by
Dauenhauer Bertha Est
Bought by
Aheron Alan K
Create a Home Valuation Report for This Property
The Home Valuation Report is an in-depth analysis detailing your home's value as well as a comparison with similar homes in the area
Purchase History
| Date | Buyer | Sale Price | Title Company |
|---|---|---|---|
| Growthways Inc | $183,000 | -- | |
| Rodriguez Eugenio | $290,000 | -- | |
| Turner Michael F | $207,000 | -- | |
| Turner Leiana J | $94,000 | -- | |
| Aheron Alan K | $78,000 | -- |
Source: Public Records
Mortgage History
| Date | Status | Borrower | Loan Amount |
|---|---|---|---|
| Previous Owner | Aheron Alan K | $272,000 | |
| Previous Owner | Aheron Alan K | $34,000 |
Source: Public Records
Tax History
| Year | Tax Paid | Tax Assessment Tax Assessment Total Assessment is a certain percentage of the fair market value that is determined by local assessors to be the total taxable value of land and additions on the property. | Land | Improvement |
|---|---|---|---|---|
| 2025 | -- | $372,700 | $144,700 | $228,000 |
| 2024 | -- | $372,700 | $144,700 | $228,000 |
| 2023 | $0 | $337,600 | $109,600 | $228,000 |
| 2022 | $0 | $307,100 | $99,600 | $207,500 |
| 2021 | $0 | $312,800 | $93,800 | $219,000 |
| 2020 | $0 | $249,400 | $89,900 | $159,500 |
| 2019 | $0 | $226,300 | $84,100 | $142,200 |
| 2018 | $0 | $219,200 | $84,100 | $135,100 |
| 2017 | $0 | $219,200 | $84,100 | $135,100 |
| 2016 | -- | $202,430 | $80,100 | $122,330 |
| 2015 | -- | $179,380 | $80,100 | $99,280 |
| 2014 | -- | $179,380 | $80,100 | $99,280 |
Source: Public Records
Map
Nearby Homes