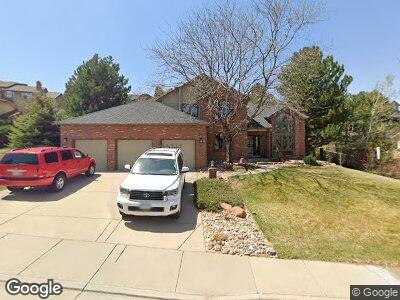
67 S Mc Intyre Way Golden, CO 80401
Mesa View Estates NeighborhoodEstimated Value: $1,314,360 - $1,376,000
5
Beds
4
Baths
4,150
Sq Ft
$323/Sq Ft
Est. Value
About This Home
This home is located at 67 S Mc Intyre Way, Golden, CO 80401 and is currently estimated at $1,342,340, approximately $323 per square foot. 67 S Mc Intyre Way is a home located in Jefferson County with nearby schools including Kyffin Elementary School, Bell Middle School, and Golden High School.
Ownership History
Date
Name
Owned For
Owner Type
Purchase Details
Closed on
Aug 15, 2011
Sold by
Oneil Robin A
Bought by
Peters Braden and Peters Meaghan Castor
Current Estimated Value
Home Financials for this Owner
Home Financials are based on the most recent Mortgage that was taken out on this home.
Original Mortgage
$265,000
Interest Rate
4.53%
Mortgage Type
New Conventional
Purchase Details
Closed on
Sep 16, 2005
Sold by
Sibel Jeffrey A and Oneil Robin A
Bought by
Oneil Robin A
Purchase Details
Closed on
Apr 30, 1999
Sold by
John Lemon
Bought by
Oneil Robin A and Sibel Jeffrey A
Home Financials for this Owner
Home Financials are based on the most recent Mortgage that was taken out on this home.
Original Mortgage
$170,400
Interest Rate
6.99%
Create a Home Valuation Report for This Property
The Home Valuation Report is an in-depth analysis detailing your home's value as well as a comparison with similar homes in the area
Home Values in the Area
Average Home Value in this Area
Purchase History
| Date | Buyer | Sale Price | Title Company |
|---|---|---|---|
| Peters Braden | $431,250 | Stewart Title | |
| Oneil Robin A | -- | -- | |
| Oneil Robin A | $340,000 | -- |
Source: Public Records
Mortgage History
| Date | Status | Borrower | Loan Amount |
|---|---|---|---|
| Open | Peters Braden | $262,430 | |
| Closed | Peters Braden | $265,000 | |
| Previous Owner | Sibel Jeffrey A | $150,000 | |
| Previous Owner | Sibel Jeffrey A | $200,000 | |
| Previous Owner | Sibel Jeffrey A | $200,000 | |
| Previous Owner | Sibel Jeffrey A | $130,742 | |
| Previous Owner | Sibel Jeffrey A | $110,000 | |
| Previous Owner | Oneil Robin A | $170,400 | |
| Previous Owner | Lemon John | $96,000 | |
| Previous Owner | Lemon Deborah S | $60,000 |
Source: Public Records
Tax History Compared to Growth
Tax History
| Year | Tax Paid | Tax Assessment Tax Assessment Total Assessment is a certain percentage of the fair market value that is determined by local assessors to be the total taxable value of land and additions on the property. | Land | Improvement |
|---|---|---|---|---|
| 2024 | $6,928 | $67,880 | $32,017 | $35,863 |
| 2023 | $6,928 | $67,880 | $32,017 | $35,863 |
| 2022 | $5,655 | $54,412 | $22,524 | $31,888 |
| 2021 | $5,728 | $55,977 | $23,172 | $32,805 |
| 2020 | $5,150 | $50,431 | $18,018 | $32,413 |
| 2019 | $5,086 | $50,431 | $18,018 | $32,413 |
| 2018 | $4,403 | $42,286 | $16,994 | $25,292 |
| 2017 | $4,034 | $42,286 | $16,994 | $25,292 |
| 2016 | $4,506 | $45,766 | $13,854 | $31,912 |
| 2015 | $3,958 | $45,766 | $13,854 | $31,912 |
| 2014 | $3,958 | $37,910 | $11,443 | $26,467 |
Source: Public Records
Map
Nearby Homes
- 15895 W Bayaud Dr
- 15887 W Ellsworth Ln
- 126 Mc Intyre Cir
- 15946 W Ellsworth Ln
- 57 Mc Intyre Cir
- 16078 W Ellsworth Dr
- 132 Loveland Way
- 16261 W Ellsworth Ave
- 15606 W 3rd Place
- 63 S Holman Way
- 16652 W Archer Ave
- 16645 W 2nd Ave
- 16655 W 2nd Ave
- 138 S Holman Way
- 412 Gladiola St
- 14259 W Virginia Dr
- 14198 W 3rd Place
- 5071 Nile Ct Unit 19
- 5053 Nile Ct Unit 12
- 14213 W Center Dr