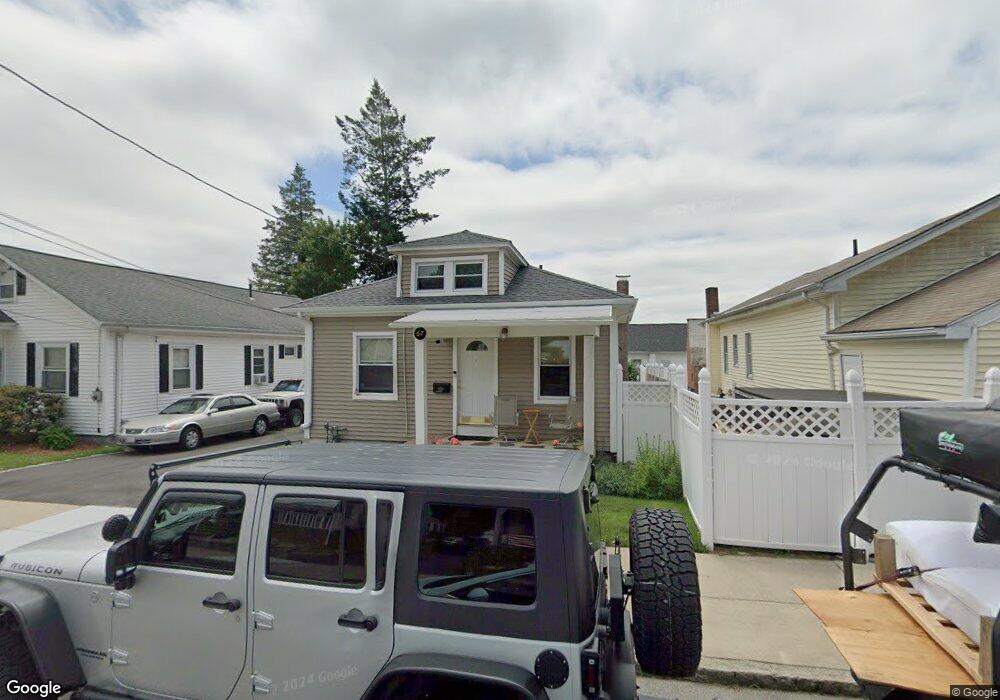
67 Sevigny St Fall River, MA 02723
Bank Street NeighborhoodEstimated Value: $377,000 - $392,000
2
Beds
1
Bath
1,512
Sq Ft
$254/Sq Ft
Est. Value
About This Home
This home is located at 67 Sevigny St, Fall River, MA 02723 and is currently estimated at $383,344, approximately $253 per square foot. 67 Sevigny St is a home located in Bristol County with nearby schools including Mary Fonseca Elementary School, Talbot Innovation School, and B M C Durfee High School.
Ownership History
Date
Name
Owned For
Owner Type
Purchase Details
Closed on
May 11, 2007
Sold by
Us Bank Na
Bought by
Souza Christine and Quartochi Michael
Current Estimated Value
Home Financials for this Owner
Home Financials are based on the most recent Mortgage that was taken out on this home.
Original Mortgage
$188,000
Outstanding Balance
$112,348
Interest Rate
6.21%
Mortgage Type
Purchase Money Mortgage
Estimated Equity
$270,996
Purchase Details
Closed on
Jun 24, 2005
Sold by
Costa Janice T
Bought by
Motta Karen A
Home Financials for this Owner
Home Financials are based on the most recent Mortgage that was taken out on this home.
Original Mortgage
$162,300
Interest Rate
5.82%
Mortgage Type
Purchase Money Mortgage
Create a Home Valuation Report for This Property
The Home Valuation Report is an in-depth analysis detailing your home's value as well as a comparison with similar homes in the area
Home Values in the Area
Average Home Value in this Area
Purchase History
| Date | Buyer | Sale Price | Title Company |
|---|---|---|---|
| Souza Christine | $188,000 | -- | |
| Us Bk | $180,400 | -- | |
| Motta Karen A | $202,900 | -- |
Source: Public Records
Mortgage History
| Date | Status | Borrower | Loan Amount |
|---|---|---|---|
| Open | Souza Christine | $188,000 | |
| Previous Owner | Motta Karen A | $162,300 |
Source: Public Records
Tax History
| Year | Tax Paid | Tax Assessment Tax Assessment Total Assessment is a certain percentage of the fair market value that is determined by local assessors to be the total taxable value of land and additions on the property. | Land | Improvement |
|---|---|---|---|---|
| 2025 | $3,761 | $328,500 | $124,000 | $204,500 |
| 2024 | $3,517 | $306,100 | $119,300 | $186,800 |
| 2023 | $3,329 | $271,300 | $102,300 | $169,000 |
| 2022 | $2,884 | $228,500 | $93,000 | $135,500 |
| 2021 | $2,730 | $197,400 | $86,100 | $111,300 |
| 2020 | $2,624 | $181,600 | $82,400 | $99,200 |
| 2019 | $2,486 | $170,500 | $78,400 | $92,100 |
| 2018 | $2,366 | $161,800 | $77,000 | $84,800 |
| 2017 | $2,264 | $161,700 | $78,500 | $83,200 |
| 2016 | $2,186 | $160,400 | $81,800 | $78,600 |
| 2015 | $2,059 | $157,400 | $78,800 | $78,600 |
| 2014 | $2,032 | $161,500 | $82,900 | $78,600 |
Source: Public Records
Map
Nearby Homes
- 243 Oak Grove Ave
- 677 Oak Grove Ave
- 217 Plain St
- 218 Plain St
- 992 Pine St
- 168 Windsor St
- 295 Newbury St
- 84 Healy St
- 10 Carlisa Dr
- 742 New Boston Rd
- 869 Bedford St
- 108 Garden St
- 884 Cherry St
- 45-47 Shawmut St
- 273 Tremont St
- 545 Robeson St
- 243 Robeson St Unit 6
- 243 Robeson St Unit 3
- 139 Quarry St
- 150 Downing St
Your Personal Tour Guide
Ask me questions while you tour the home.