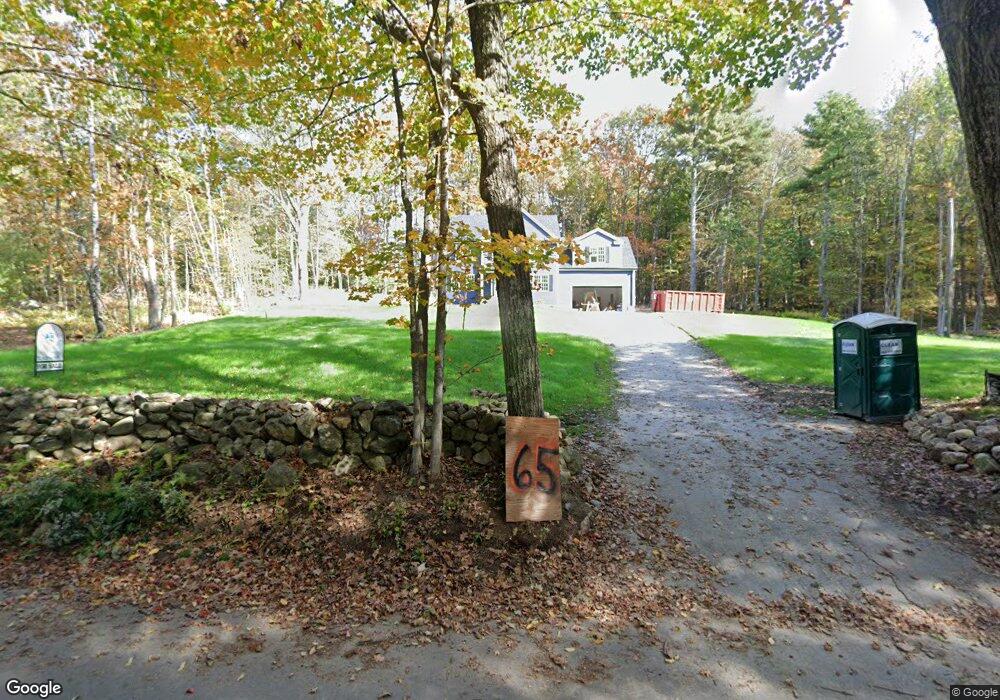
67 Shady Ave Westminster, MA 01473
Estimated Value: $670,000 - $738,000
3
Beds
4
Baths
2,600
Sq Ft
$268/Sq Ft
Est. Value
About This Home
This home is located at 67 Shady Ave, Westminster, MA 01473 and is currently estimated at $695,741, approximately $267 per square foot. 67 Shady Ave is a home located in Worcester County with nearby schools including Oakmont Regional High School and Holy Family Academy.
Ownership History
Date
Name
Owned For
Owner Type
Purchase Details
Closed on
Oct 30, 2002
Sold by
Benjamin Bldrs Rt and Lorden Gary
Bought by
Livingstone Joshua A and Livingstone Jennifer R
Current Estimated Value
Home Financials for this Owner
Home Financials are based on the most recent Mortgage that was taken out on this home.
Original Mortgage
$200,000
Interest Rate
6.09%
Mortgage Type
Purchase Money Mortgage
Create a Home Valuation Report for This Property
The Home Valuation Report is an in-depth analysis detailing your home's value as well as a comparison with similar homes in the area
Home Values in the Area
Average Home Value in this Area
Purchase History
| Date | Buyer | Sale Price | Title Company |
|---|---|---|---|
| Livingstone Joshua A | $285,172 | -- |
Source: Public Records
Mortgage History
| Date | Status | Borrower | Loan Amount |
|---|---|---|---|
| Closed | Livingstone Joshua A | $194,500 | |
| Closed | Livingstone Joshua A | $39,000 | |
| Closed | Livingstone Joshua A | $196,000 | |
| Closed | Livingstone Joshua A | $200,000 |
Source: Public Records
Tax History Compared to Growth
Tax History
| Year | Tax Paid | Tax Assessment Tax Assessment Total Assessment is a certain percentage of the fair market value that is determined by local assessors to be the total taxable value of land and additions on the property. | Land | Improvement |
|---|---|---|---|---|
| 2025 | $7,797 | $633,900 | $142,400 | $491,500 |
| 2024 | $7,444 | $607,200 | $142,400 | $464,800 |
| 2023 | $7,234 | $553,900 | $133,200 | $420,700 |
| 2022 | $7,388 | $467,600 | $116,900 | $350,700 |
| 2021 | $7,581 | $452,300 | $103,100 | $349,200 |
| 2020 | $7,439 | $423,900 | $94,500 | $329,400 |
| 2019 | $7,470 | $409,300 | $79,900 | $329,400 |
| 2018 | $7,309 | $394,000 | $79,900 | $314,100 |
| 2017 | $7,047 | $387,400 | $79,900 | $307,500 |
| 2016 | $6,721 | $357,900 | $67,800 | $290,100 |
| 2015 | $6,703 | $353,700 | $67,800 | $285,900 |
| 2014 | $6,658 | $350,800 | $67,800 | $283,000 |
Source: Public Records
Map
Nearby Homes