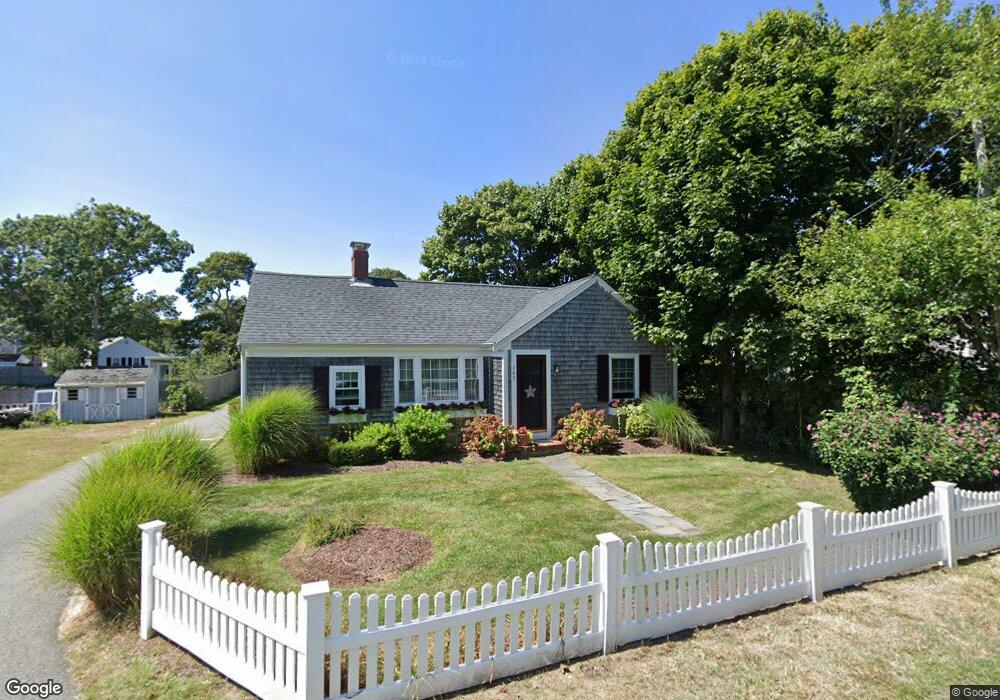
67 South St Dennis Port, MA 02639
Dennis Port NeighborhoodEstimated Value: $589,000 - $818,000
2
Beds
1
Bath
910
Sq Ft
$777/Sq Ft
Est. Value
About This Home
This home is located at 67 South St, Dennis Port, MA 02639 and is currently estimated at $707,223, approximately $777 per square foot. 67 South St is a home located in Barnstable County with nearby schools including Dennis-Yarmouth Regional High School and St. Pius X. School.
Ownership History
Date
Name
Owned For
Owner Type
Purchase Details
Closed on
Dec 13, 2018
Sold by
Cassidy Joanne
Bought by
Joanne Cassidy Lt and Cassidy
Current Estimated Value
Purchase Details
Closed on
Sep 10, 2013
Sold by
Gray Herbert P and Gray Donald L
Bought by
Dunbar Bruce J and Dunbar Mary C
Purchase Details
Closed on
Mar 18, 2013
Sold by
Gray Herbert P and Gray Priscilla E
Bought by
Gray Herbert P
Purchase Details
Closed on
Feb 13, 1990
Sold by
Sears Earle S
Bought by
Gray Priscila E
Create a Home Valuation Report for This Property
The Home Valuation Report is an in-depth analysis detailing your home's value as well as a comparison with similar homes in the area
Home Values in the Area
Average Home Value in this Area
Purchase History
| Date | Buyer | Sale Price | Title Company |
|---|---|---|---|
| Joanne Cassidy Lt | -- | -- | |
| Joanne Cassidy Lt | -- | -- | |
| Dunbar Bruce J | $325,000 | -- | |
| Gray Herbert P | -- | -- | |
| Gray Priscila E | $20,000 | -- |
Source: Public Records
Tax History Compared to Growth
Tax History
| Year | Tax Paid | Tax Assessment Tax Assessment Total Assessment is a certain percentage of the fair market value that is determined by local assessors to be the total taxable value of land and additions on the property. | Land | Improvement |
|---|---|---|---|---|
| 2025 | $2,981 | $688,400 | $390,500 | $297,900 |
| 2024 | $2,814 | $641,100 | $375,600 | $265,500 |
| 2023 | $2,722 | $582,800 | $341,400 | $241,400 |
| 2022 | $2,727 | $486,900 | $307,600 | $179,300 |
| 2021 | $2,657 | $440,700 | $301,500 | $139,200 |
| 2020 | $2,799 | $458,900 | $301,500 | $157,400 |
| 2019 | $2,232 | $361,700 | $221,700 | $140,000 |
| 2018 | $2,242 | $353,700 | $221,600 | $132,100 |
| 2017 | $2,175 | $353,700 | $221,600 | $132,100 |
| 2016 | $3,072 | $470,500 | $361,800 | $108,700 |
| 2015 | $3,011 | $470,500 | $361,800 | $108,700 |
| 2014 | $2,055 | $323,700 | $253,300 | $70,400 |
Source: Public Records
Map
Nearby Homes
- 159 Center St Unit 22
- 221 Upper County Rd Unit 2A
- 221 Upper County Rd Unit 2A
- 12 Cross St
- 47 Telegraph Rd Unit 1
- 12 Candlewood Ln Unit 2-9
- 73 Division St
- 9 Country Ln
- 26 Manning Rd
- 166 Upper County Rd Unit 1-4
- 141 Division St
- 141 Division St
- 148 Belmont Rd
- 40 Willow St
- 45 Route 28
- 79 Massachusetts 28
- 3 Fairbanks Dr
- 268 Main St
- 72 Bassett Ln
- 6 Bayberry Ln
- 71 South St
- 202 Depot St
- 59 South St
- 77 South St
- 55 South St
- 83 South St
- 90 South St
- 78 South St
- 20 South St
- 195 Depot St
- 12 South St
- 12 South St Unit 2-6
- 12 South St Unit 2-5
- 12 South St Unit 2-4
- 12 South St Unit 2-3
- 12 South St Unit 2-2
- 12 South St Unit 2-1
- 12 South St Unit 1-6
- 12 South St Unit 1-5
- 12 South St Unit 1-4