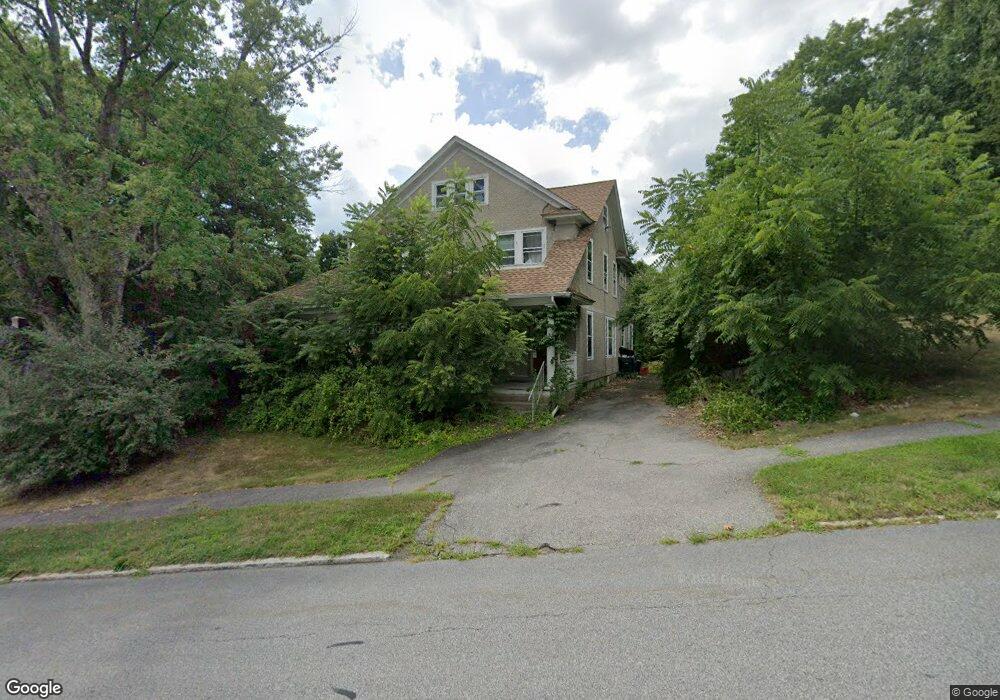
67 Spencer St Winsted, CT 06098
Estimated Value: $266,894 - $400,000
4
Beds
1
Bath
3,180
Sq Ft
$111/Sq Ft
Est. Value
About This Home
This home is located at 67 Spencer St, Winsted, CT 06098 and is currently estimated at $354,224, approximately $111 per square foot. 67 Spencer St is a home located in Litchfield County with nearby schools including Pearson School, Explorations Charter School, and St Anthony School.
Ownership History
Date
Name
Owned For
Owner Type
Purchase Details
Closed on
Feb 1, 2005
Sold by
Arena Lois
Bought by
Collier Susan L
Current Estimated Value
Home Financials for this Owner
Home Financials are based on the most recent Mortgage that was taken out on this home.
Original Mortgage
$180,000
Outstanding Balance
$91,009
Interest Rate
5.67%
Estimated Equity
$263,215
Purchase Details
Closed on
May 10, 1993
Sold by
Ct Galaxy Prop Inc
Bought by
Fox Glenn A
Create a Home Valuation Report for This Property
The Home Valuation Report is an in-depth analysis detailing your home's value as well as a comparison with similar homes in the area
Home Values in the Area
Average Home Value in this Area
Purchase History
| Date | Buyer | Sale Price | Title Company |
|---|---|---|---|
| Collier Susan L | $230,000 | -- | |
| Collier Susan L | $230,000 | -- | |
| Fox Glenn A | $105,000 | -- | |
| Fox Glenn A | $105,000 | -- |
Source: Public Records
Mortgage History
| Date | Status | Borrower | Loan Amount |
|---|---|---|---|
| Open | Fox Glenn A | $180,000 | |
| Closed | Fox Glenn A | $180,000 |
Source: Public Records
Tax History
| Year | Tax Paid | Tax Assessment Tax Assessment Total Assessment is a certain percentage of the fair market value that is determined by local assessors to be the total taxable value of land and additions on the property. | Land | Improvement |
|---|---|---|---|---|
| 2025 | $4,196 | $143,850 | $26,670 | $117,180 |
| 2024 | $3,918 | $143,850 | $26,670 | $117,180 |
| 2023 | $3,796 | $143,850 | $26,670 | $117,180 |
| 2022 | $4,184 | $124,740 | $19,390 | $105,350 |
| 2021 | $4,184 | $124,740 | $19,390 | $105,350 |
| 2020 | $4,184 | $124,740 | $19,390 | $105,350 |
| 2019 | $4,184 | $124,740 | $19,390 | $105,350 |
| 2018 | $4,184 | $124,740 | $19,390 | $105,350 |
| 2017 | $3,942 | $117,530 | $19,390 | $98,140 |
| 2016 | $3,942 | $117,530 | $19,390 | $98,140 |
| 2015 | $3,843 | $117,530 | $19,390 | $98,140 |
| 2014 | $3,750 | $117,530 | $19,390 | $98,140 |
Source: Public Records
Map
Nearby Homes
- 61 Spencer St
- 66 Spencer Hill Rd
- 70 Spencer St
- 62 Spencer St
- 1 Brookside Ave
- 11 Upland Rd
- 12 Upland Rd
- 55 Spencer St
- 1 Brookside Ave
- 80 Spencer St
- 52 Spencer St
- 49 Spencer St
- 3 Brookside Ave
- 88 Spencer St
- 88 Spencer St Unit 2
- 88 Spencer St Unit 3
- 88 Spencer St Unit 1
- 88 Spencer St Unit 1F
- 88 Spencer St Unit 1R Apt 2
Your Personal Tour Guide
Ask me questions while you tour the home.