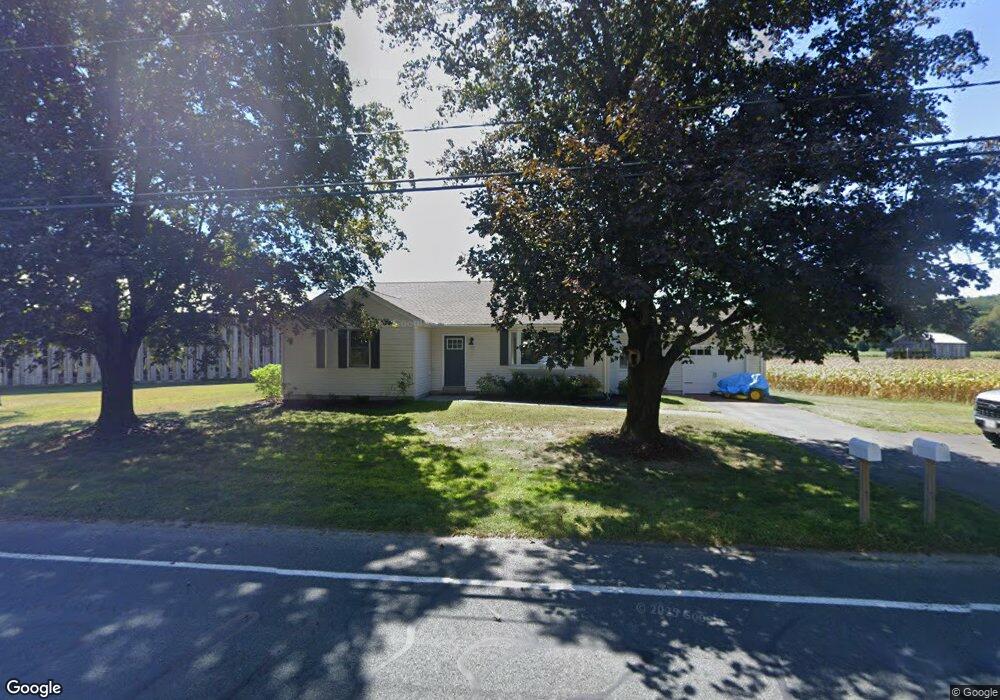
67 Stockbridge St Hadley, MA 01035
Estimated Value: $483,000 - $611,000
2
Beds
2
Baths
1,065
Sq Ft
$500/Sq Ft
Est. Value
About This Home
This home is located at 67 Stockbridge St, Hadley, MA 01035 and is currently estimated at $532,509, approximately $500 per square foot. 67 Stockbridge St is a home located in Hampshire County with nearby schools including Hadley Elementary School, Pioneer Valley Chinese Immersion Charter School, and The Common School.
Ownership History
Date
Name
Owned For
Owner Type
Purchase Details
Closed on
Apr 20, 2021
Sold by
Whitlock Henry
Bought by
Ober Jeremy D
Current Estimated Value
Purchase Details
Closed on
Sep 9, 2020
Sold by
Koroski Anthony Est
Bought by
Whitlock Henry and Toth Gary
Purchase Details
Closed on
Feb 25, 2016
Sold by
Koroski Sharon F
Bought by
Koroski Anthony
Create a Home Valuation Report for This Property
The Home Valuation Report is an in-depth analysis detailing your home's value as well as a comparison with similar homes in the area
Home Values in the Area
Average Home Value in this Area
Purchase History
| Date | Buyer | Sale Price | Title Company |
|---|---|---|---|
| Ober Jeremy D | $425,000 | None Available | |
| Whitlock Henry | $179,900 | None Available | |
| Koroski Anthony | -- | -- |
Source: Public Records
Tax History Compared to Growth
Tax History
| Year | Tax Paid | Tax Assessment Tax Assessment Total Assessment is a certain percentage of the fair market value that is determined by local assessors to be the total taxable value of land and additions on the property. | Land | Improvement |
|---|---|---|---|---|
| 2025 | $5,502 | $473,100 | $106,100 | $367,000 |
| 2024 | $5,201 | $456,600 | $106,100 | $350,500 |
| 2023 | $4,935 | $427,600 | $106,100 | $321,500 |
| 2022 | $4,404 | $361,600 | $106,100 | $255,500 |
| 2021 | $2,374 | $197,800 | $106,100 | $91,700 |
| 2020 | $2,663 | $208,400 | $106,100 | $102,300 |
| 2019 | $2,576 | $208,400 | $106,100 | $102,300 |
| 2018 | $2,520 | $208,400 | $106,100 | $102,300 |
| 2017 | $2,412 | $208,500 | $106,100 | $102,400 |
| 2016 | $2,325 | $208,500 | $106,100 | $102,400 |
| 2015 | $2,264 | $208,500 | $106,100 | $102,400 |
| 2014 | $2,218 | $208,500 | $106,100 | $102,400 |
Source: Public Records
Map
Nearby Homes
- 7 Roosevelt St
- 39 Valley Ln
- 88 Farview Way
- 65 N Prospect St
- 18 N Prospect St
- 136 Main St
- 11 Sheerman Ln
- 13 Harlow Dr
- 185 Cherry Ln
- 161 Chestnut St
- 3 Depot Rd
- 48 Gray St
- 26 Greenleaves Dr Unit 620
- 328 Russell St
- 958 E Pleasant St
- 58 Main St Unit 4
- 58 Main St Unit 3
- 0 Red Gate Ln Unit 73348273
- 110 Grantwood Dr
- 305 Strong St
- 67 Stockbridge St
- 66 Stockbridge St
- 64 Stockbridge St
- 58 Stockbridge St Unit rd.
- 58 Stockbridge St
- 58 Stockbridge St Unit 58
- 56 Stockbridge St
- 57 Stockbridge St
- 53 Stockbridge St
- 39 Roosevelt St
- 88 Stockbridge St
- 89 Stockbridge St
- 89 Stockbridge St
- 90 Stockbridge Rd
- 54 Stockbridge Rd
- 55 Stockbridge St
- 93 Stockbridge Rd
- 91 Stockbridge St
- 92 Stockbridge St
- 92 Stockbridge St