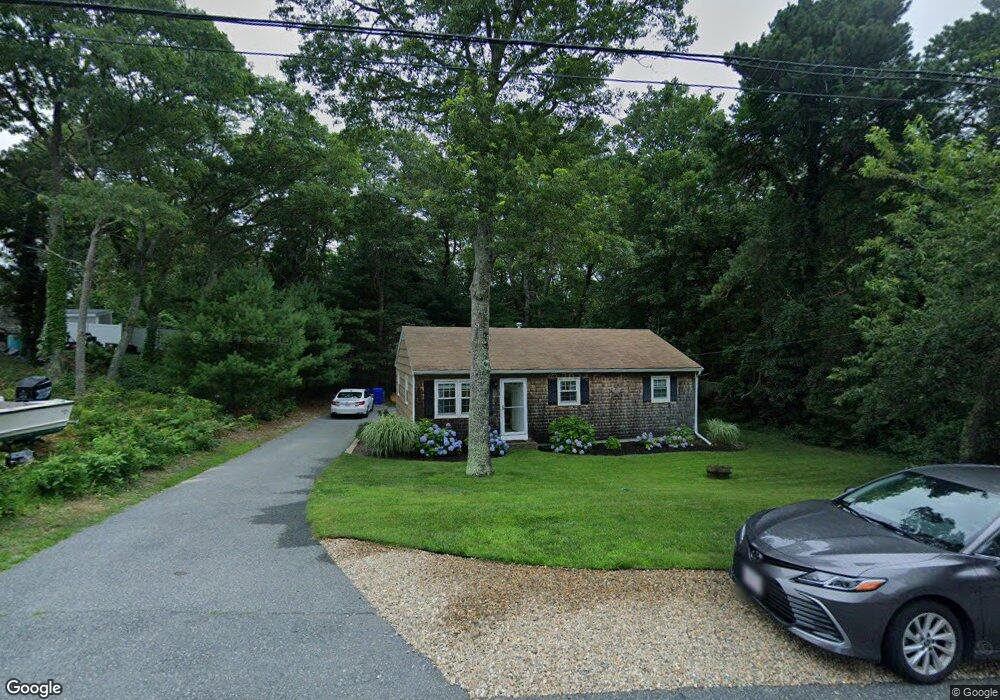
67 Thom Ave Bourne, MA 2532
Monument Beach NeighborhoodEstimated Value: $462,000 - $533,000
3
Beds
2
Baths
912
Sq Ft
$534/Sq Ft
Est. Value
About This Home
This home is located at 67 Thom Ave, Bourne, MA 2532 and is currently estimated at $487,103, approximately $534 per square foot. 67 Thom Ave is a home located in Barnstable County with nearby schools including Bourne High School, Cadence Academy Preschool - Bourne, and St Margaret Regional School.
Ownership History
Date
Name
Owned For
Owner Type
Purchase Details
Closed on
Aug 26, 2016
Sold by
Gibbons William T and Gibbons Mary E
Bought by
Lendh Lesley
Current Estimated Value
Home Financials for this Owner
Home Financials are based on the most recent Mortgage that was taken out on this home.
Original Mortgage
$205,200
Outstanding Balance
$162,961
Interest Rate
3.42%
Mortgage Type
New Conventional
Estimated Equity
$324,142
Purchase Details
Closed on
May 16, 2013
Sold by
Us Bank Na
Bought by
Gibbons William T and Gibbons Mary E
Purchase Details
Closed on
Aug 10, 2012
Sold by
Gregory Catherine and Us Bank Na
Bought by
Us Bank Na
Create a Home Valuation Report for This Property
The Home Valuation Report is an in-depth analysis detailing your home's value as well as a comparison with similar homes in the area
Home Values in the Area
Average Home Value in this Area
Purchase History
| Date | Buyer | Sale Price | Title Company |
|---|---|---|---|
| Lendh Lesley | $228,000 | -- | |
| Lendh Lesley | $228,000 | -- | |
| Gibbons William T | $188,900 | -- | |
| Gibbons William T | $188,900 | -- | |
| Us Bank Na | $157,250 | -- | |
| Us Bank Na | $157,250 | -- |
Source: Public Records
Mortgage History
| Date | Status | Borrower | Loan Amount |
|---|---|---|---|
| Open | Lendh Lesley | $205,200 | |
| Closed | Lendh Lesley | $205,200 | |
| Previous Owner | Us Bank Na | $136,500 | |
| Previous Owner | Us Bank Na | $110,500 |
Source: Public Records
Tax History
| Year | Tax Paid | Tax Assessment Tax Assessment Total Assessment is a certain percentage of the fair market value that is determined by local assessors to be the total taxable value of land and additions on the property. | Land | Improvement |
|---|---|---|---|---|
| 2025 | $2,915 | $373,300 | $190,800 | $182,500 |
| 2024 | $2,850 | $355,400 | $181,700 | $173,700 |
| 2023 | $2,771 | $314,500 | $160,800 | $153,700 |
| 2022 | $2,667 | $264,300 | $142,300 | $122,000 |
| 2021 | $2,591 | $240,600 | $129,500 | $111,100 |
| 2020 | $2,508 | $233,500 | $128,300 | $105,200 |
| 2019 | $2,392 | $227,600 | $128,300 | $99,300 |
| 2018 | $5,588 | $207,200 | $116,400 | $90,800 |
| 2017 | $5,421 | $196,500 | $115,300 | $81,200 |
| 2016 | $1,979 | $194,800 | $115,300 | $79,500 |
| 2015 | $1,962 | $194,800 | $115,300 | $79,500 |
Source: Public Records
Map
Nearby Homes
- 20 Colony Ave
- 4 Harbor Hill Dr
- 16 Amberwood Ct
- 203 County Rd
- 12 Turnberry Rd Unit 12
- 566 Shore Rd
- 4 Hollyhock Knoll Ct Unit 4
- 4 Hollyhock Knoll Ct Unit 4
- 13 Laurel Hill Ct
- 5 Sea Knoll Ct
- 3 1st St
- 709 County Rd
- 5 Zoli Ln
- 3 4th Ave
- 7 4th Ave
- 14 Navajo Rd
- 254 Barlows Landing Rd
- 16 Michael Rd
- 44 Cotuit Rd
- 35 Benedict Rd
Your Personal Tour Guide
Ask me questions while you tour the home.