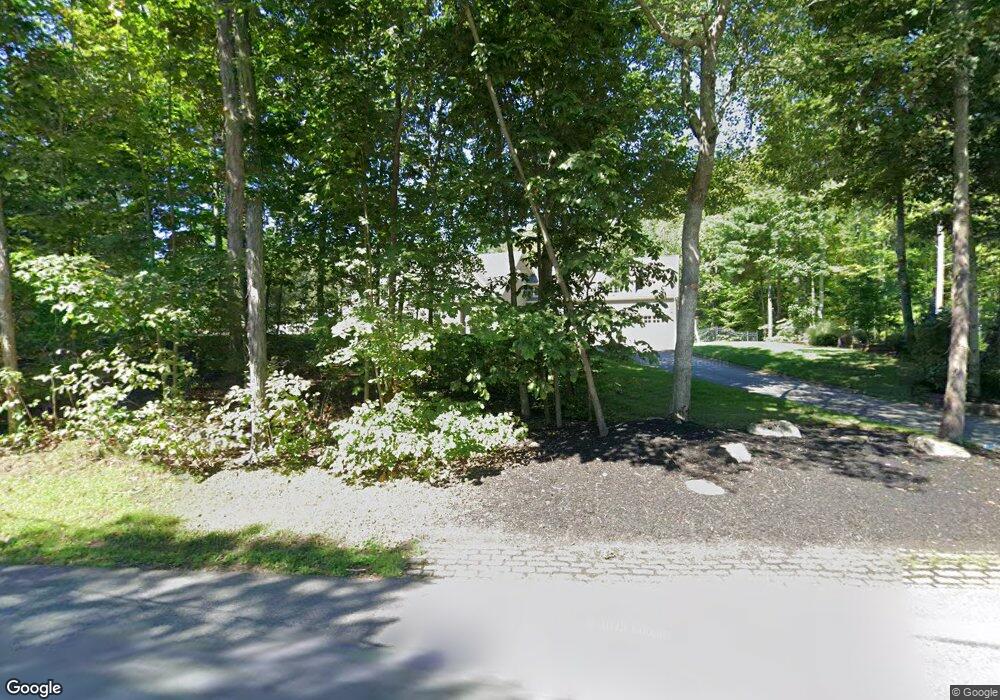
67 Twiss Ln Hollis, NH 03049
Hollis NeighborhoodEstimated Value: $1,383,000 - $1,716,000
4
Beds
6
Baths
6,012
Sq Ft
$263/Sq Ft
Est. Value
About This Home
This home is located at 67 Twiss Ln, Hollis, NH 03049 and is currently estimated at $1,578,231, approximately $262 per square foot. 67 Twiss Ln is a home with nearby schools including Hollis Primary School, Hollis Upper Elementary School, and Hollis-Brookline Middle School.
Ownership History
Date
Name
Owned For
Owner Type
Purchase Details
Closed on
Jan 26, 2012
Sold by
Fitzgerald Christopher M
Bought by
Fitzgerald Ruthuane F and Fitzgerald Ruthuane F
Current Estimated Value
Purchase Details
Closed on
Feb 17, 1998
Sold by
J J Construction Llc
Bought by
Fitzgera Christopher M and Fitzgerald Ruthanne R
Home Financials for this Owner
Home Financials are based on the most recent Mortgage that was taken out on this home.
Original Mortgage
$225,000
Interest Rate
6.95%
Create a Home Valuation Report for This Property
The Home Valuation Report is an in-depth analysis detailing your home's value as well as a comparison with similar homes in the area
Home Values in the Area
Average Home Value in this Area
Purchase History
| Date | Buyer | Sale Price | Title Company |
|---|---|---|---|
| Fitzgerald Ruthuane F | -- | -- | |
| Fitzgera Christopher M | $348,000 | -- |
Source: Public Records
Mortgage History
| Date | Status | Borrower | Loan Amount |
|---|---|---|---|
| Previous Owner | Fitzgera Christopher M | $225,000 |
Source: Public Records
Tax History Compared to Growth
Tax History
| Year | Tax Paid | Tax Assessment Tax Assessment Total Assessment is a certain percentage of the fair market value that is determined by local assessors to be the total taxable value of land and additions on the property. | Land | Improvement |
|---|---|---|---|---|
| 2024 | $23,762 | $1,340,200 | $286,700 | $1,053,500 |
| 2023 | $22,328 | $1,340,200 | $286,700 | $1,053,500 |
| 2022 | $30,248 | $1,340,200 | $286,700 | $1,053,500 |
| 2021 | $19,122 | $842,400 | $189,000 | $653,400 |
| 2020 | $19,527 | $842,400 | $189,000 | $653,400 |
| 2019 | $19,459 | $842,400 | $189,000 | $653,400 |
| 2018 | $18,255 | $842,400 | $189,000 | $653,400 |
| 2017 | $18,087 | $781,300 | $164,400 | $616,900 |
| 2016 | $18,306 | $781,300 | $164,400 | $616,900 |
| 2015 | $17,986 | $781,300 | $164,400 | $616,900 |
| 2014 | $18,071 | $781,300 | $164,400 | $616,900 |
| 2013 | $17,829 | $781,300 | $164,400 | $616,900 |
Source: Public Records
Map
Nearby Homes