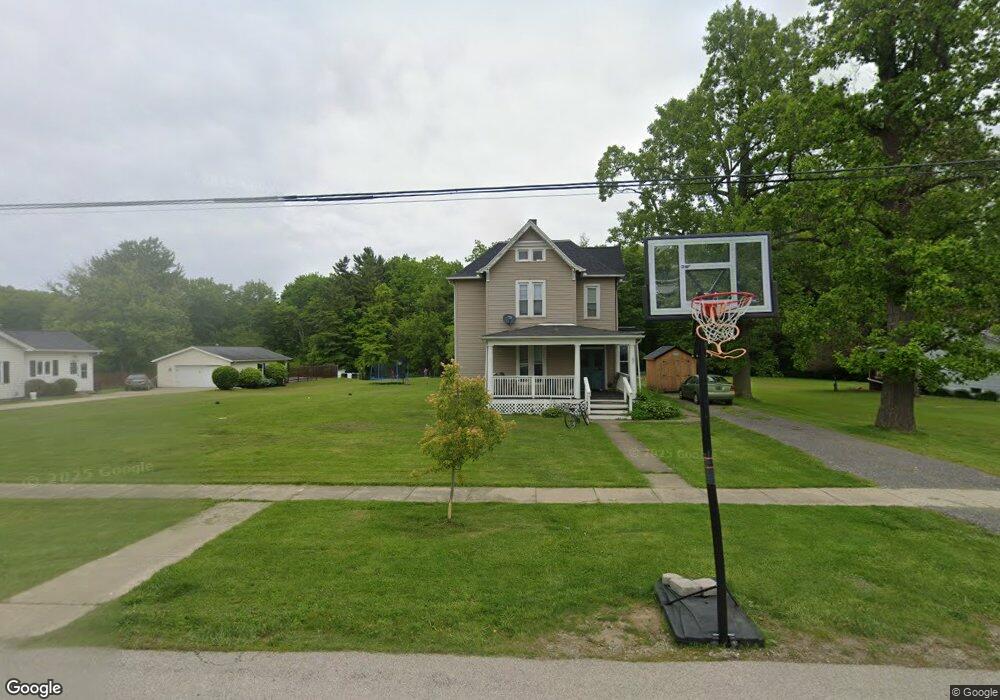
67 W Ashtabula St Jefferson, OH 44047
Estimated Value: $175,246 - $240,000
3
Beds
2
Baths
1,608
Sq Ft
$128/Sq Ft
Est. Value
About This Home
This home is located at 67 W Ashtabula St, Jefferson, OH 44047 and is currently estimated at $206,562, approximately $128 per square foot. 67 W Ashtabula St is a home located in Ashtabula County with nearby schools including Jefferson Elementary School, Jefferson Area Junior High School, and Jefferson Area Senior High School.
Ownership History
Date
Name
Owned For
Owner Type
Purchase Details
Closed on
May 2, 2017
Sold by
Pelorus Financial Properties Llc
Bought by
Valenti Micah T and Valenti Erin G
Current Estimated Value
Purchase Details
Closed on
Sep 21, 2015
Sold by
Knapp Tina M
Bought by
Pelorus Financial Properties Llc
Purchase Details
Closed on
Jun 24, 2010
Sold by
Burnett Stephanie L
Bought by
Knapp Tina M
Home Financials for this Owner
Home Financials are based on the most recent Mortgage that was taken out on this home.
Original Mortgage
$106,500
Interest Rate
4.97%
Mortgage Type
Unknown
Purchase Details
Closed on
Oct 30, 1995
Sold by
Burr Catherine H
Bought by
Burnett Robert M and Burnett Stephanie L
Home Financials for this Owner
Home Financials are based on the most recent Mortgage that was taken out on this home.
Original Mortgage
$46,900
Interest Rate
7.65%
Mortgage Type
New Conventional
Create a Home Valuation Report for This Property
The Home Valuation Report is an in-depth analysis detailing your home's value as well as a comparison with similar homes in the area
Home Values in the Area
Average Home Value in this Area
Purchase History
| Date | Buyer | Sale Price | Title Company |
|---|---|---|---|
| Valenti Micah T | $105,545 | Chicago Title | |
| Pelorus Financial Properties Llc | $36,410 | Ohio Real Estate Title Inc | |
| Knapp Tina M | $106,500 | Venture Title | |
| Burnett Robert M | $59,000 | -- |
Source: Public Records
Mortgage History
| Date | Status | Borrower | Loan Amount |
|---|---|---|---|
| Previous Owner | Knapp Tina M | $106,500 | |
| Previous Owner | Burnett Robert M | $46,900 |
Source: Public Records
Tax History Compared to Growth
Tax History
| Year | Tax Paid | Tax Assessment Tax Assessment Total Assessment is a certain percentage of the fair market value that is determined by local assessors to be the total taxable value of land and additions on the property. | Land | Improvement |
|---|---|---|---|---|
| 2024 | $4,122 | $47,360 | $12,780 | $34,580 |
| 2023 | $2,199 | $47,360 | $12,780 | $34,580 |
| 2022 | $1,757 | $34,520 | $9,840 | $24,680 |
| 2021 | $1,680 | $34,520 | $9,840 | $24,680 |
| 2020 | $1,687 | $34,520 | $9,840 | $24,680 |
| 2019 | $1,714 | $34,060 | $11,380 | $22,680 |
| 2018 | $1,663 | $34,060 | $11,380 | $22,680 |
| 2017 | $1,319 | $34,060 | $11,380 | $22,680 |
| 2016 | $1,689 | $33,780 | $11,270 | $22,510 |
| 2015 | $1,809 | $33,780 | $11,270 | $22,510 |
| 2014 | $2,269 | $33,780 | $11,270 | $22,510 |
| 2013 | $1,686 | $31,640 | $10,360 | $21,280 |
Source: Public Records
Map
Nearby Homes
- 116 Willis Ave
- V/L Ohio 167
- 0 Vl St Rt 307
- 2234 Ohio 307
- 187 Garfield Ln
- 157 W Monroe Cir
- 942 State Route 307 W
- 309 Woodland Way Unit A
- 0 State Route 307 Unit 5168871
- 0 State Route 307 Unit LotWP001
- 1067 Garrett Rd
- 1449 Thiel Rd
- 1450 Dadeyville Rd
- 1821 State Route 307
- 1749 Black Sea Rd
- 0000 Black Sea Rd
- 1945 Dadeyville Rd
- 2189 Jefferson Eagleville Rd
- 2977 Ohio 307
- 9019 Ohio 45
- 55 W Ashtabula St
- 73 W Ashtabula St
- 79 W Ashtabula St
- 66 W Ashtabula St
- 49 W Ashtabula St
- 62 W Ashtabula St
- 58 W Ashtabula St
- 50 W Ashtabula St
- 43 W Ashtabula St
- 142 Willis Ave
- 39 W Ashtabula St
- 97 W Ashtabula St
- 40 W Ashtabula St
- 138 Willis Ave
- 137 Uselma Ave
- 33 W Ashtabula St
- 130 Willis Ave
- 82 W Ashtabula St
- 135 Uselma Ave
- 98 W Ashtabula St