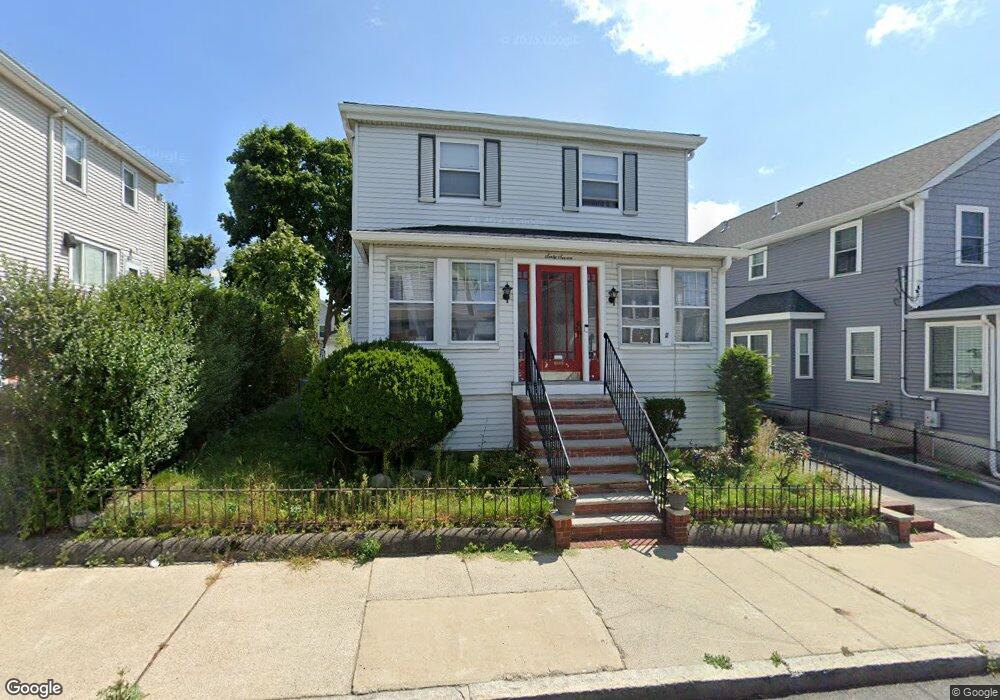
67 Windsor St Everett, MA 02149
Glendale NeighborhoodEstimated Value: $638,000 - $802,000
4
Beds
2
Baths
1,680
Sq Ft
$438/Sq Ft
Est. Value
About This Home
This home is located at 67 Windsor St, Everett, MA 02149 and is currently estimated at $736,052, approximately $438 per square foot. 67 Windsor St is a home located in Middlesex County with nearby schools including Everett High School.
Ownership History
Date
Name
Owned For
Owner Type
Purchase Details
Closed on
Oct 23, 2006
Sold by
Curnane Joseph A
Bought by
Tesfay Freweyni T and Isayass Mulugheta
Current Estimated Value
Home Financials for this Owner
Home Financials are based on the most recent Mortgage that was taken out on this home.
Original Mortgage
$294,400
Outstanding Balance
$175,965
Interest Rate
6.49%
Mortgage Type
Purchase Money Mortgage
Estimated Equity
$560,087
Create a Home Valuation Report for This Property
The Home Valuation Report is an in-depth analysis detailing your home's value as well as a comparison with similar homes in the area
Home Values in the Area
Average Home Value in this Area
Purchase History
| Date | Buyer | Sale Price | Title Company |
|---|---|---|---|
| Tesfay Freweyni T | $368,000 | -- |
Source: Public Records
Mortgage History
| Date | Status | Borrower | Loan Amount |
|---|---|---|---|
| Open | Tesfay Freweyni T | $294,400 |
Source: Public Records
Tax History
| Year | Tax Paid | Tax Assessment Tax Assessment Total Assessment is a certain percentage of the fair market value that is determined by local assessors to be the total taxable value of land and additions on the property. | Land | Improvement |
|---|---|---|---|---|
| 2025 | $6,823 | $599,000 | $249,400 | $349,600 |
| 2024 | $6,187 | $539,900 | $218,500 | $321,400 |
| 2023 | $6,031 | $512,000 | $209,000 | $303,000 |
| 2022 | $4,968 | $479,500 | $199,500 | $280,000 |
| 2021 | $4,345 | $440,200 | $178,600 | $261,600 |
| 2020 | $4,635 | $435,600 | $178,600 | $257,000 |
| 2019 | $4,904 | $396,100 | $170,100 | $226,000 |
| 2018 | $4,542 | $329,600 | $148,200 | $181,400 |
| 2017 | $4,250 | $294,300 | $133,000 | $161,300 |
| 2016 | $3,955 | $273,700 | $118,800 | $154,900 |
| 2015 | $3,727 | $255,100 | $107,100 | $148,000 |
Source: Public Records
Map
Nearby Homes
- 5 Mason St
- 1 Elwood St
- 881 Broadway Unit 28
- 859 Broadway Unit 15
- 102 Suffolk St
- 40 Glendale Ave
- 39 Broadway Unit 305
- 528 Ferry St
- 19 Mills St
- 33 Lodgen Ct Unit 2D
- 53 Sycamore St
- 17 Jones St Unit 2
- 272-274 Cross St Unit 4
- 272-274 Cross St Unit 3
- 15 Waverly Ave
- 7 Parker St Unit 1
- 40-42 Upham St Unit 1
- 44 Walnut St
- 21 Central Ave Unit 10
- 21 Staples Ave Unit 26
Your Personal Tour Guide
Ask me questions while you tour the home.