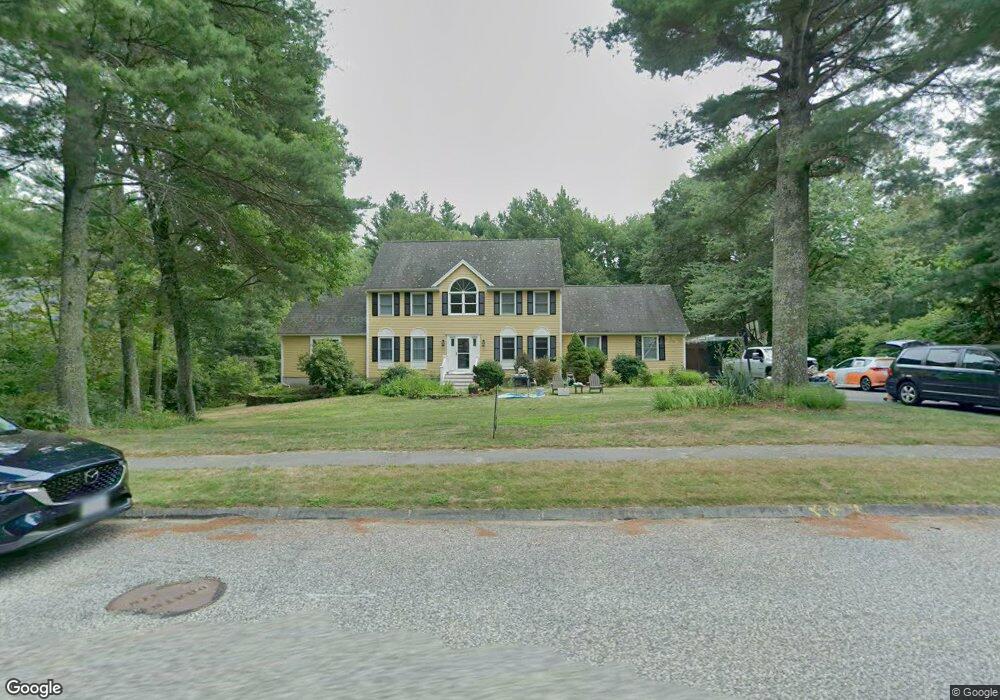
67 York Rd Mansfield, MA 02048
Estimated Value: $1,060,170 - $1,245,000
3
Beds
4
Baths
3,596
Sq Ft
$314/Sq Ft
Est. Value
About This Home
This home is located at 67 York Rd, Mansfield, MA 02048 and is currently estimated at $1,130,293, approximately $314 per square foot. 67 York Rd is a home located in Bristol County with nearby schools including Everett W. Robinson Elementary School, Jordan/Jackson Elementary School, and Harold L. Qualters Middle School.
Ownership History
Date
Name
Owned For
Owner Type
Purchase Details
Closed on
Aug 31, 2006
Sold by
Sirva Relocation Llc
Bought by
Riley Dennis and Riley Katherine
Current Estimated Value
Purchase Details
Closed on
Jun 28, 1996
Sold by
Allen Herbert M and Allen Marie L
Bought by
Panyard David B and Panyard Erika M
Purchase Details
Closed on
Aug 27, 1991
Sold by
East Coast Dev Ltd
Bought by
Allen Herbert M and Marie Allen
Create a Home Valuation Report for This Property
The Home Valuation Report is an in-depth analysis detailing your home's value as well as a comparison with similar homes in the area
Home Values in the Area
Average Home Value in this Area
Purchase History
| Date | Buyer | Sale Price | Title Company |
|---|---|---|---|
| Riley Dennis | $680,000 | -- | |
| Sirva Relocation Llc | $680,000 | -- | |
| Panyard David B | $311,000 | -- | |
| Allen Herbert M | $262,087 | -- |
Source: Public Records
Mortgage History
| Date | Status | Borrower | Loan Amount |
|---|---|---|---|
| Open | Allen Herbert M | $398,000 | |
| Closed | Allen Herbert M | $405,000 |
Source: Public Records
Tax History
| Year | Tax Paid | Tax Assessment Tax Assessment Total Assessment is a certain percentage of the fair market value that is determined by local assessors to be the total taxable value of land and additions on the property. | Land | Improvement |
|---|---|---|---|---|
| 2025 | $12,288 | $933,000 | $324,600 | $608,400 |
| 2024 | $11,387 | $843,500 | $286,600 | $556,900 |
| 2023 | $10,899 | $773,500 | $286,600 | $486,900 |
| 2022 | $10,442 | $688,300 | $266,000 | $422,300 |
| 2021 | $10,641 | $692,800 | $241,000 | $451,800 |
| 2020 | $10,460 | $681,000 | $241,000 | $440,000 |
| 2019 | $10,150 | $666,900 | $218,100 | $448,800 |
| 2018 | $10,111 | $649,400 | $208,500 | $440,900 |
| 2017 | $9,488 | $631,700 | $202,800 | $428,900 |
| 2016 | $9,004 | $584,300 | $200,400 | $383,900 |
| 2015 | $8,758 | $565,000 | $200,400 | $364,600 |
Source: Public Records
Map
Nearby Homes
- 85 Jewell St
- 78 Old Farm Rd
- 150 Gilbert St
- 24 Maverick Dr
- 14 Claire Ave
- 25 Munroe Dr
- 451R Gilbert St
- 52 White Oak Way
- 2 Oak St Unit 2A
- 2 Oak St Unit 2B
- 49 Pheasant Hill Rd
- 115 Westfield Dr
- 9 Coach Rd
- 37 Oakleaf Dr
- 57 Vine St
- 16 Treasure Island Rd
- 71 Richardson Ave
- Lot 5 Jeffrey Dr
- Lot 2 Jeffrey Dr
- 28 Messenger St
Your Personal Tour Guide
Ask me questions while you tour the home.