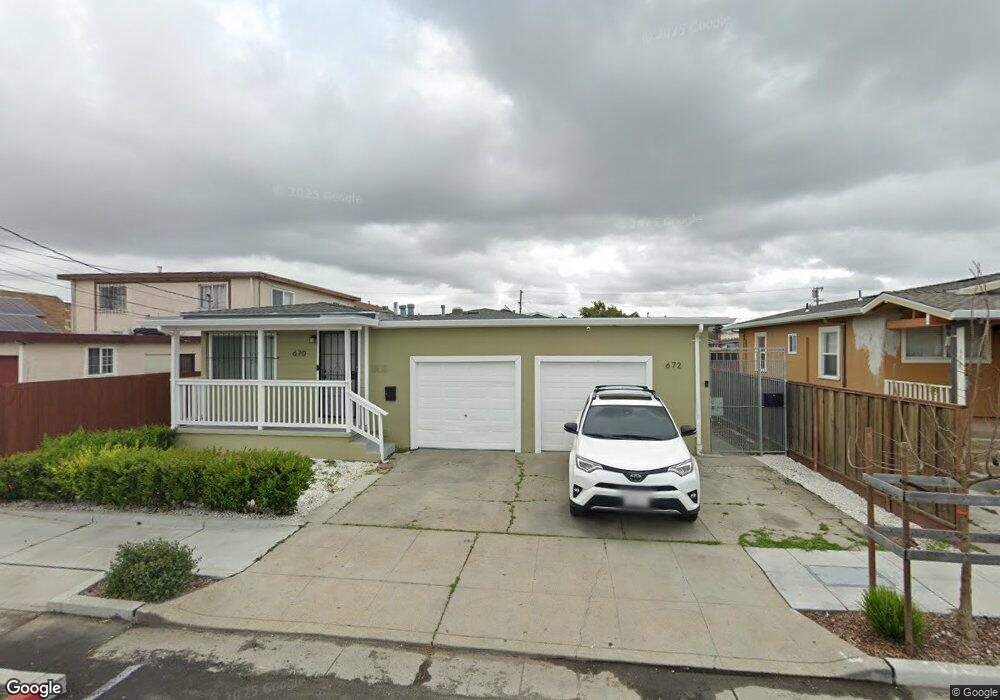
670 8th St Richmond, CA 94801
Iron Triangle NeighborhoodEstimated Value: $436,000 - $702,000
4
Beds
2
Baths
1,516
Sq Ft
$389/Sq Ft
Est. Value
About This Home
This home is located at 670 8th St, Richmond, CA 94801 and is currently estimated at $590,040, approximately $389 per square foot. 670 8th St is a home located in Contra Costa County with nearby schools including Peres Elementary School, Walter T. Helms Middle School, and Richmond High School.
Ownership History
Date
Name
Owned For
Owner Type
Purchase Details
Closed on
Apr 5, 2019
Sold by
Lopez Leopoldo and Lopez Yolanda
Bought by
Lopez Blanca and Huezo Jose Guadalupe
Current Estimated Value
Home Financials for this Owner
Home Financials are based on the most recent Mortgage that was taken out on this home.
Original Mortgage
$268,000
Outstanding Balance
$235,620
Interest Rate
4.3%
Mortgage Type
New Conventional
Estimated Equity
$354,420
Purchase Details
Closed on
Apr 13, 2001
Sold by
Santamaria Cyrus T and Santamaria Luisa J
Bought by
Lopez Leopoldo and Lopez Yolanda
Home Financials for this Owner
Home Financials are based on the most recent Mortgage that was taken out on this home.
Original Mortgage
$147,600
Interest Rate
6.98%
Mortgage Type
Purchase Money Mortgage
Purchase Details
Closed on
Sep 21, 1999
Sold by
Ringor Epifania T and Santa Maria T
Bought by
Santamaria Cyrus T and Santamaria Luisa J
Create a Home Valuation Report for This Property
The Home Valuation Report is an in-depth analysis detailing your home's value as well as a comparison with similar homes in the area
Home Values in the Area
Average Home Value in this Area
Purchase History
| Date | Buyer | Sale Price | Title Company |
|---|---|---|---|
| Lopez Blanca | $335,000 | North American Title Co Inc | |
| Lopez Leopoldo | $164,000 | New Century Title Company | |
| Santamaria Cyrus T | -- | -- |
Source: Public Records
Mortgage History
| Date | Status | Borrower | Loan Amount |
|---|---|---|---|
| Open | Lopez Blanca | $268,000 | |
| Previous Owner | Lopez Leopoldo | $147,600 |
Source: Public Records
Tax History Compared to Growth
Tax History
| Year | Tax Paid | Tax Assessment Tax Assessment Total Assessment is a certain percentage of the fair market value that is determined by local assessors to be the total taxable value of land and additions on the property. | Land | Improvement |
|---|---|---|---|---|
| 2025 | $10,165 | $557,755 | $334,654 | $223,101 |
| 2024 | $9,892 | $546,820 | $328,093 | $218,727 |
| 2023 | $9,892 | $536,099 | $321,660 | $214,439 |
| 2022 | $9,688 | $525,588 | $315,353 | $210,235 |
| 2021 | $9,568 | $515,283 | $309,170 | $206,113 |
| 2019 | $5,131 | $221,516 | $93,198 | $128,318 |
| 2018 | $4,938 | $217,173 | $91,371 | $125,802 |
| 2017 | $4,800 | $212,916 | $89,580 | $123,336 |
| 2016 | $4,698 | $208,742 | $87,824 | $120,918 |
| 2015 | $4,632 | $205,607 | $86,505 | $119,102 |
| 2014 | $4,616 | $201,580 | $84,811 | $116,769 |
Source: Public Records
Map
Nearby Homes