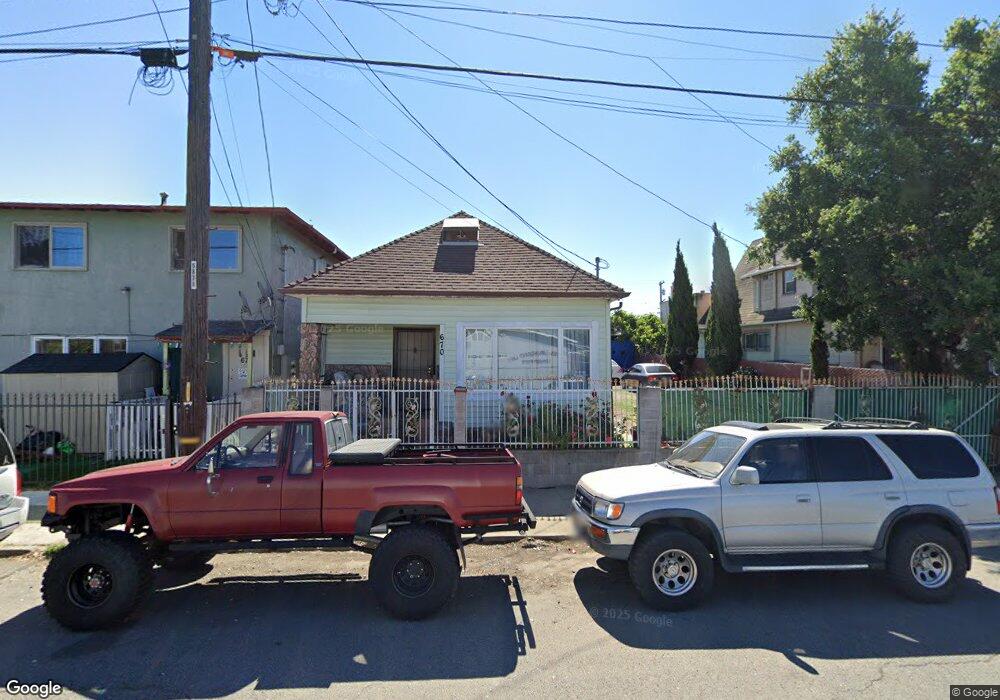
670 9th St Richmond, CA 94801
Iron Triangle NeighborhoodEstimated Value: $350,000 - $450,000
3
Beds
1
Bath
742
Sq Ft
$532/Sq Ft
Est. Value
About This Home
This home is located at 670 9th St, Richmond, CA 94801 and is currently estimated at $395,096, approximately $532 per square foot. 670 9th St is a home located in Contra Costa County with nearby schools including Peres Elementary School, Walter T. Helms Middle School, and Richmond High School.
Ownership History
Date
Name
Owned For
Owner Type
Purchase Details
Closed on
Jan 17, 2024
Sold by
Linnane Austin and Linnane Christine
Bought by
Linnane Family Trust and Linnane
Current Estimated Value
Purchase Details
Closed on
Jan 18, 2017
Sold by
Linnane Austin and Linnane Christine
Bought by
Linnane Austin and Linnane Christine
Home Financials for this Owner
Home Financials are based on the most recent Mortgage that was taken out on this home.
Original Mortgage
$165,000
Interest Rate
4.13%
Mortgage Type
New Conventional
Purchase Details
Closed on
Mar 5, 2009
Sold by
Deutsche Bank National Trust Company
Bought by
Linnane Austin and Linnane Christine
Purchase Details
Closed on
Jun 25, 2008
Sold by
Martinez Juan and Martinez Maria
Bought by
Deutsche Bank National Trust Co
Purchase Details
Closed on
Apr 23, 2004
Sold by
Martinez Maria
Bought by
Martinez Juan and Martinez Maria
Home Financials for this Owner
Home Financials are based on the most recent Mortgage that was taken out on this home.
Original Mortgage
$172,000
Interest Rate
4.62%
Mortgage Type
Stand Alone Refi Refinance Of Original Loan
Purchase Details
Closed on
Feb 26, 2004
Sold by
Martinez Juan
Bought by
Martinez Maria
Home Financials for this Owner
Home Financials are based on the most recent Mortgage that was taken out on this home.
Original Mortgage
$172,000
Interest Rate
4.62%
Mortgage Type
Stand Alone Refi Refinance Of Original Loan
Purchase Details
Closed on
Oct 3, 2002
Sold by
Barron Helen M
Bought by
Martinez Juan and Martinez Maria
Home Financials for this Owner
Home Financials are based on the most recent Mortgage that was taken out on this home.
Original Mortgage
$164,900
Interest Rate
6.05%
Mortgage Type
Purchase Money Mortgage
Purchase Details
Closed on
Apr 20, 1995
Sold by
Barron Helen M
Bought by
Barron Helen M
Home Financials for this Owner
Home Financials are based on the most recent Mortgage that was taken out on this home.
Original Mortgage
$75,000
Interest Rate
8.44%
Mortgage Type
Purchase Money Mortgage
Create a Home Valuation Report for This Property
The Home Valuation Report is an in-depth analysis detailing your home's value as well as a comparison with similar homes in the area
Home Values in the Area
Average Home Value in this Area
Purchase History
| Date | Buyer | Sale Price | Title Company |
|---|---|---|---|
| Linnane Family Trust | -- | None Listed On Document | |
| Linnane Austin | $100,000 | Chicago Title Company | |
| Linnane Austin | $30,000 | Fidelity National Title Co | |
| Deutsche Bank National Trust Co | $189,900 | North American Title Company | |
| Martinez Juan | -- | Fidelity National Title Co | |
| Martinez Maria | -- | Fidelity National Title | |
| Martinez Juan | $170,000 | Commonwealth Title | |
| Barron Helen M | -- | North American Title Co |
Source: Public Records
Mortgage History
| Date | Status | Borrower | Loan Amount |
|---|---|---|---|
| Previous Owner | Linnane Austin | $165,000 | |
| Previous Owner | Martinez Maria | $172,000 | |
| Previous Owner | Martinez Juan | $164,900 | |
| Previous Owner | Barron Helen M | $75,000 |
Source: Public Records
Tax History Compared to Growth
Tax History
| Year | Tax Paid | Tax Assessment Tax Assessment Total Assessment is a certain percentage of the fair market value that is determined by local assessors to be the total taxable value of land and additions on the property. | Land | Improvement |
|---|---|---|---|---|
| 2025 | $3,772 | $165,538 | $93,477 | $72,061 |
| 2024 | $3,729 | $162,294 | $91,645 | $70,649 |
| 2023 | $3,729 | $159,113 | $89,849 | $69,264 |
| 2022 | $3,630 | $155,994 | $88,088 | $67,906 |
| 2021 | $3,559 | $152,936 | $86,361 | $66,575 |
| 2019 | $3,332 | $148,401 | $83,800 | $64,601 |
| 2018 | $3,208 | $145,492 | $82,157 | $63,335 |
| 2017 | $1,585 | $33,281 | $11,093 | $22,188 |
| 2016 | $1,522 | $32,629 | $10,876 | $21,753 |
| 2015 | $1,478 | $32,140 | $10,713 | $21,427 |
| 2014 | $1,476 | $31,512 | $10,504 | $21,008 |
Source: Public Records
Map
Nearby Homes