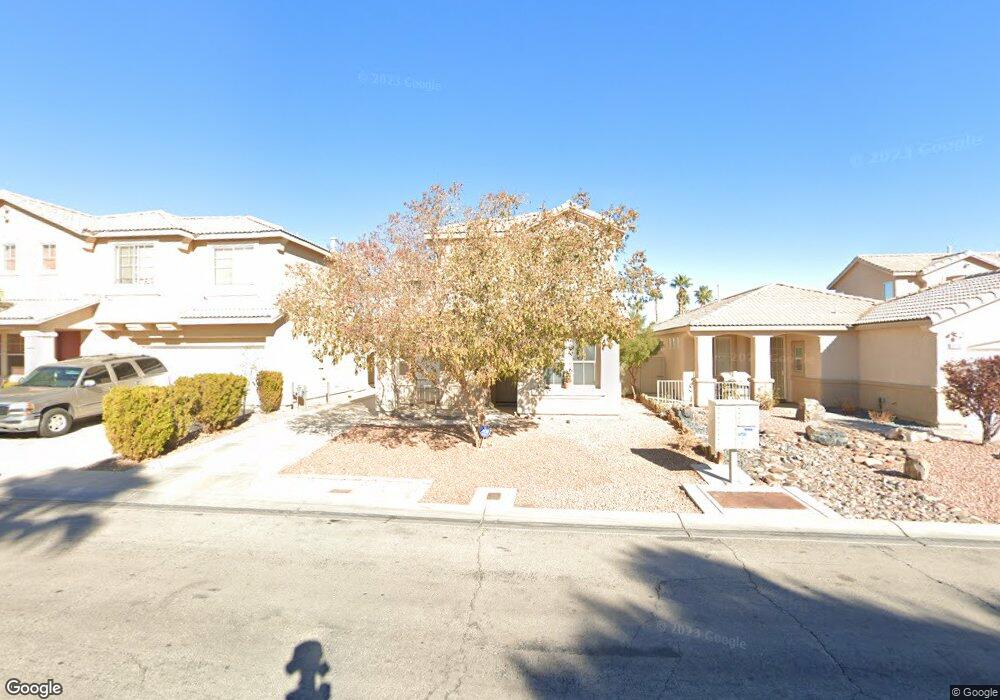
670 Baldurn Ave Las Vegas, NV 89183
Silverado Ranch NeighborhoodEstimated Value: $411,351 - $434,000
3
Beds
3
Baths
1,529
Sq Ft
$277/Sq Ft
Est. Value
About This Home
This home is located at 670 Baldurn Ave, Las Vegas, NV 89183 and is currently estimated at $424,088, approximately $277 per square foot. 670 Baldurn Ave is a home located in Clark County with nearby schools including John R. Hummel Elementary School, Charles Silvestri Junior High School, and Liberty High School.
Ownership History
Date
Name
Owned For
Owner Type
Purchase Details
Closed on
Jan 17, 2002
Sold by
Rivera Anibal
Bought by
Rivera Anibal and Rivera Maribel
Current Estimated Value
Home Financials for this Owner
Home Financials are based on the most recent Mortgage that was taken out on this home.
Original Mortgage
$134,550
Outstanding Balance
$55,257
Interest Rate
7.11%
Estimated Equity
$368,831
Purchase Details
Closed on
Jul 26, 2000
Sold by
Rivera Maribel
Bought by
Rivera Anibal
Home Financials for this Owner
Home Financials are based on the most recent Mortgage that was taken out on this home.
Original Mortgage
$103,400
Interest Rate
8.2%
Purchase Details
Closed on
Jul 7, 2000
Sold by
Del Webbs Coventry Homes Of Nevada Inc
Bought by
Rivera Anibal
Home Financials for this Owner
Home Financials are based on the most recent Mortgage that was taken out on this home.
Original Mortgage
$103,400
Interest Rate
8.2%
Create a Home Valuation Report for This Property
The Home Valuation Report is an in-depth analysis detailing your home's value as well as a comparison with similar homes in the area
Home Values in the Area
Average Home Value in this Area
Purchase History
| Date | Buyer | Sale Price | Title Company |
|---|---|---|---|
| Rivera Anibal | -- | Equity Title | |
| Rivera Anibal | -- | Del Webb Title Company Nevad | |
| Rivera Anibal | $137,890 | Del Webb Title Company Nevad |
Source: Public Records
Mortgage History
| Date | Status | Borrower | Loan Amount |
|---|---|---|---|
| Open | Rivera Anibal | $134,550 | |
| Closed | Rivera Anibal | $103,400 | |
| Closed | Rivera Anibal | $27,500 |
Source: Public Records
Tax History Compared to Growth
Tax History
| Year | Tax Paid | Tax Assessment Tax Assessment Total Assessment is a certain percentage of the fair market value that is determined by local assessors to be the total taxable value of land and additions on the property. | Land | Improvement |
|---|---|---|---|---|
| 2025 | $2,184 | $96,363 | $35,350 | $61,013 |
| 2024 | $2,023 | $96,363 | $35,350 | $61,013 |
| 2023 | $2,023 | $88,863 | $31,150 | $57,713 |
| 2022 | $1,873 | $79,410 | $26,600 | $52,810 |
| 2021 | $1,735 | $76,216 | $25,900 | $50,316 |
| 2020 | $1,608 | $72,933 | $23,100 | $49,833 |
| 2019 | $1,507 | $69,020 | $19,950 | $49,070 |
| 2018 | $1,438 | $65,689 | $18,550 | $47,139 |
| 2017 | $1,874 | $63,894 | $16,100 | $47,794 |
| 2016 | $1,347 | $59,254 | $12,250 | $47,004 |
| 2015 | $1,343 | $45,770 | $8,400 | $37,370 |
| 2014 | $1,304 | $43,140 | $7,000 | $36,140 |
Source: Public Records
Map
Nearby Homes
- 694 Baldurn Ave
- 9801 Bradford Summit St
- 9639 Idle Spurs Dr
- 754 Canfield Point Ave
- 9792 Cordova Vista Ct
- 555 E Silverado Ranch Blvd Unit 2075
- 555 E Silverado Ranch Blvd Unit 2130
- 555 E Silverado Ranch Blvd Unit 2168
- 555 E Silverado Ranch Blvd Unit 2064
- 555 E Silverado Ranch Blvd Unit 2086
- 555 E Silverado Ranch Blvd Unit 1017
- 555 E Silverado Ranch Blvd Unit 1123
- 555 E Silverado Ranch Blvd Unit 1172
- 555 E Silverado Ranch Blvd Unit 1131
- 555 E Silverado Ranch Blvd Unit 2147
- 555 E Silverado Ranch Blvd Unit 1034
- 555 E Silverado Ranch Blvd Unit 2028
- 9854 Canterbury Creek St
- 9617 Pine River Ln
- 710 Elliot Peak Ave
- 676 Baldurn Ave
- 664 Baldurn Ave
- 682 Baldurn Ave
- 658 Baldurn Ave
- 652 Baldurn Ave
- 688 Baldurn Ave
- 9732 Altadena St
- 677 Baldurn Ave
- 646 Baldurn Ave Unit 1
- 683 Baldurn Ave
- 9740 Altadena St Unit None
- 689 Baldurn Ave
- 640 Baldurn Ave
- 647 Baldurn Ave
- 695 Baldurn Ave Unit 1
- 9748 Altadena St Unit 1
- 9695 Blue Calico Dr
- 634 Baldurn Ave
- 701 Baldurn Ave Unit 1
- 670 Canfield Point Ave