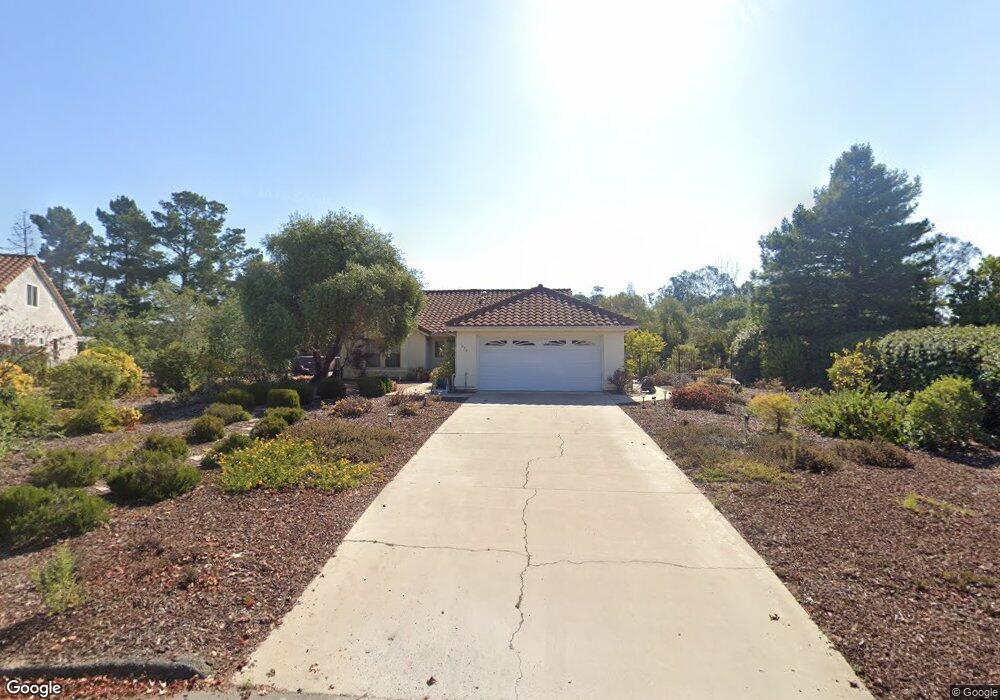
670 Black Ridge Ln Nipomo, CA 93444
Blacklake NeighborhoodEstimated Value: $770,000 - $890,353
3
Beds
2
Baths
1,611
Sq Ft
$523/Sq Ft
Est. Value
About This Home
This home is located at 670 Black Ridge Ln, Nipomo, CA 93444 and is currently estimated at $842,088, approximately $522 per square foot. 670 Black Ridge Ln is a home located in San Luis Obispo County with nearby schools including Dorothea Lange Elementary School, Mesa Middle School, and Nipomo High School.
Ownership History
Date
Name
Owned For
Owner Type
Purchase Details
Closed on
Feb 16, 2005
Sold by
Bogle T G and Bogle De Lois
Bought by
Grieb Gary A and Grieb Pyong Su
Current Estimated Value
Purchase Details
Closed on
Nov 19, 1997
Sold by
Pickett Teddy L and Pickett Robbie J
Bought by
Bogle T G and Bogle De Lois
Purchase Details
Closed on
Aug 1, 1995
Sold by
Pickett Teddy L and Pickett Robbie J
Bought by
Pickett Teddy L and Pickett Robbie J
Purchase Details
Closed on
Oct 3, 1994
Sold by
Tuckness Thomas H and Tuckness Juanita W
Bought by
Pickett Ted and Pickett Robbie
Home Financials for this Owner
Home Financials are based on the most recent Mortgage that was taken out on this home.
Original Mortgage
$35,000
Interest Rate
8.55%
Create a Home Valuation Report for This Property
The Home Valuation Report is an in-depth analysis detailing your home's value as well as a comparison with similar homes in the area
Home Values in the Area
Average Home Value in this Area
Purchase History
| Date | Buyer | Sale Price | Title Company |
|---|---|---|---|
| Grieb Gary A | $550,000 | Chicago Title Company | |
| Bogle T G | $215,000 | Fidelity National Title Co | |
| Pickett Teddy L | -- | -- | |
| Pickett Ted | $180,000 | Cuesta Title Guaranty Co |
Source: Public Records
Mortgage History
| Date | Status | Borrower | Loan Amount |
|---|---|---|---|
| Previous Owner | Pickett Ted | $35,000 |
Source: Public Records
Tax History Compared to Growth
Tax History
| Year | Tax Paid | Tax Assessment Tax Assessment Total Assessment is a certain percentage of the fair market value that is determined by local assessors to be the total taxable value of land and additions on the property. | Land | Improvement |
|---|---|---|---|---|
| 2025 | $3,868 | $267,715 | $79,222 | $188,493 |
| 2024 | $3,844 | $262,467 | $77,669 | $184,798 |
| 2023 | $3,844 | $257,322 | $76,147 | $181,175 |
| 2022 | $3,813 | $252,277 | $74,654 | $177,623 |
| 2021 | $2,652 | $247,332 | $73,191 | $174,141 |
| 2020 | $2,622 | $244,797 | $72,441 | $172,356 |
| 2019 | $2,605 | $239,998 | $71,021 | $168,977 |
| 2018 | $2,573 | $235,293 | $69,629 | $165,664 |
| 2017 | $2,518 | $230,680 | $68,264 | $162,416 |
| 2016 | $2,376 | $226,158 | $66,926 | $159,232 |
| 2015 | $2,342 | $222,762 | $65,921 | $156,841 |
| 2014 | -- | $218,399 | $64,630 | $153,769 |
Source: Public Records
Map
Nearby Homes
- 1150 Redberry Place
- 639 Barberry Way
- 1337 Black Sage Cir
- 1060 Dawn Rd
- 1225 Dawn Rd
- 940 Calle Fresa
- 1276 Pomeroy Rd
- 1024 Maggie Ln
- 1354 Trail View Place
- 1084 Emma Ln
- 961 Jacqueline Place
- 977 Jacqueline Place
- 1441 Vicki Ln
- 462 Camino Perillo
- 1539 Vista Tesoro Place
- 1255 Viva Way
- 808 Albert Way
- 708 Albert Way
- 1790 Calle Laguna
- 1147 Vaquero Way
- 660 Black Ridge Ln
- 680 Black Ridge Ln
- 690 Black Ridge Ln
- 650 Black Ridge Ln
- 685 Black Ridge Ln
- 655 Black Ridge Ln
- 1250 Willow Rd
- 665 Black Ridge Ln
- 675 Black Ridge Ln
- 685 Shelter Ridge Place
- 640 Black Ridge Ln
- 1853 Willow Rd
- 680 Shelter Ridge Place
- 679 Shelter Ridge Place
- 630 Black Ridge Ln
- 673 Shelter Ridge Place
- 1190 Redberry Place
- 635 Black Ridge Ln
- 620 Black Ridge Ln
- 1248 Black Sage Cir