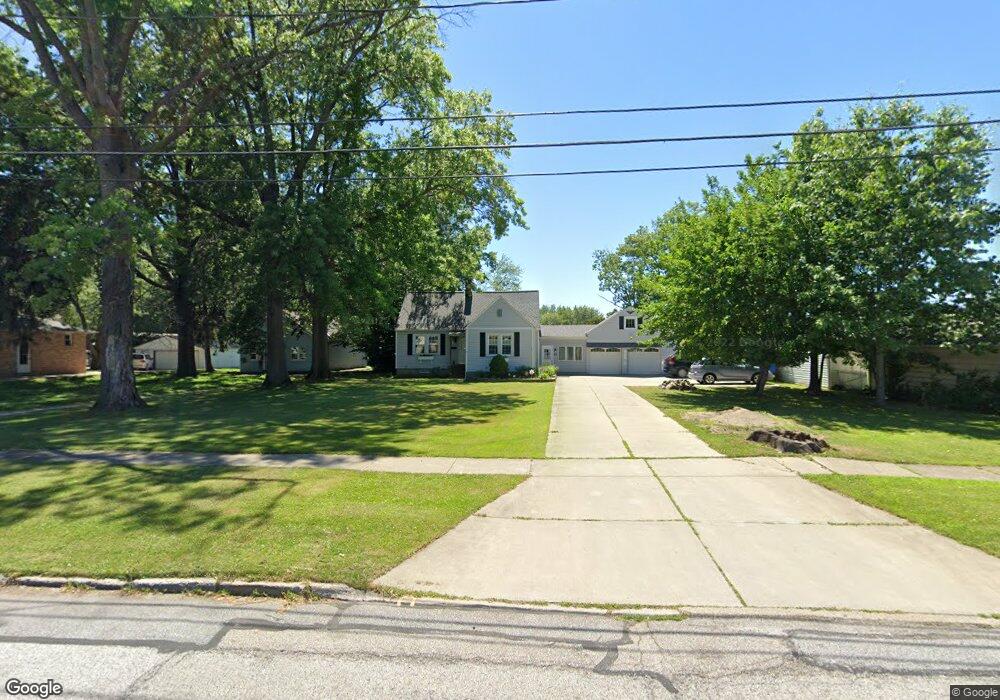
670 Bryn Mawr Ave Wickliffe, OH 44092
Estimated Value: $192,000 - $262,000
4
Beds
2
Baths
1,392
Sq Ft
$157/Sq Ft
Est. Value
About This Home
This home is located at 670 Bryn Mawr Ave, Wickliffe, OH 44092 and is currently estimated at $219,034, approximately $157 per square foot. 670 Bryn Mawr Ave is a home located in Lake County with nearby schools including Wickliffe Elementary School, Wickliffe Middle School, and Wickliffe High School.
Ownership History
Date
Name
Owned For
Owner Type
Purchase Details
Closed on
Feb 1, 2007
Sold by
Federal Home Loan Mortgage Corporation
Bought by
Barnard Donald A and Barnard Pamela J
Current Estimated Value
Home Financials for this Owner
Home Financials are based on the most recent Mortgage that was taken out on this home.
Original Mortgage
$94,400
Outstanding Balance
$56,730
Interest Rate
6.22%
Mortgage Type
Purchase Money Mortgage
Estimated Equity
$162,304
Purchase Details
Closed on
Jul 24, 2006
Sold by
Mullen Hugh J and Principal Residential Mortgage
Bought by
Federal Home Loan Mortgage Corporation
Purchase Details
Closed on
Jul 2, 1999
Sold by
Sichner Patricia A and Spooner Patricia A
Bought by
Mullen Hugh J
Home Financials for this Owner
Home Financials are based on the most recent Mortgage that was taken out on this home.
Original Mortgage
$118,750
Interest Rate
7.43%
Purchase Details
Closed on
Jul 1, 1993
Bought by
Sichner Patricia A
Create a Home Valuation Report for This Property
The Home Valuation Report is an in-depth analysis detailing your home's value as well as a comparison with similar homes in the area
Home Values in the Area
Average Home Value in this Area
Purchase History
| Date | Buyer | Sale Price | Title Company |
|---|---|---|---|
| Barnard Donald A | $118,000 | Attorney | |
| Federal Home Loan Mortgage Corporation | $120,000 | None Available | |
| Mullen Hugh J | $125,000 | Commonwealth Land Title Agen | |
| Sichner Patricia A | $114,500 | -- |
Source: Public Records
Mortgage History
| Date | Status | Borrower | Loan Amount |
|---|---|---|---|
| Open | Barnard Donald A | $94,400 | |
| Previous Owner | Mullen Hugh J | $118,750 |
Source: Public Records
Tax History Compared to Growth
Tax History
| Year | Tax Paid | Tax Assessment Tax Assessment Total Assessment is a certain percentage of the fair market value that is determined by local assessors to be the total taxable value of land and additions on the property. | Land | Improvement |
|---|---|---|---|---|
| 2024 | -- | $66,380 | $17,360 | $49,020 |
| 2023 | $7,337 | $59,660 | $14,850 | $44,810 |
| 2022 | $4,280 | $59,660 | $14,850 | $44,810 |
| 2021 | $4,298 | $59,660 | $14,850 | $44,810 |
| 2020 | $4,146 | $48,910 | $12,180 | $36,730 |
| 2019 | $4,144 | $48,910 | $12,180 | $36,730 |
| 2018 | $3,664 | $53,190 | $25,730 | $27,460 |
| 2017 | $3,743 | $53,190 | $25,730 | $27,460 |
| 2016 | $3,964 | $53,190 | $25,730 | $27,460 |
| 2015 | $3,659 | $53,190 | $25,730 | $27,460 |
| 2014 | $3,223 | $53,190 | $25,730 | $27,460 |
| 2013 | $3,221 | $53,190 | $25,730 | $27,460 |
Source: Public Records
Map
Nearby Homes
- 27709 Parkwood Dr
- 557 Ezmor Ln
- 459 Lloyd Rd
- 295 E 276th St
- 625 Lloyd Rd
- 29616 Grand Blvd
- 278 E 286th St
- 445 E 275th St
- 840 Talmadge Ave
- 251 E 286th St
- 150 Westbrook Dr
- 335 Blissfield Dr
- 29459 Vinewood Dr
- 369 E 270th St
- 29448 Vinewood Dr
- 440 E 271st St
- 546 Walnut Dr
- 461 E 271st St
- 970 Bryn Mawr Ave
- 559 Sycamore Dr
- 674 Bryn Mawr Ave
- 29370 Parkwood Dr
- 29356 Parkwood Dr
- 680 Bryn Mawr Ave
- 29386 Parkwood Dr
- SL Bryn Mawr
- 355 E 280th St
- 351 E 280th St
- 684 Bryn Mawr Ave
- 361 E 280th St
- 347 E 280th St
- 347 E 280th St Unit E
- 643 N Elmwood Ave
- 365 E 280th St
- 29414 Parkwood Dr
- 343 E 280th St
- 369 E 280th St
- 649 N Elmwood Ave
- 29430 Parkwood Dr
- 373 E 280th St