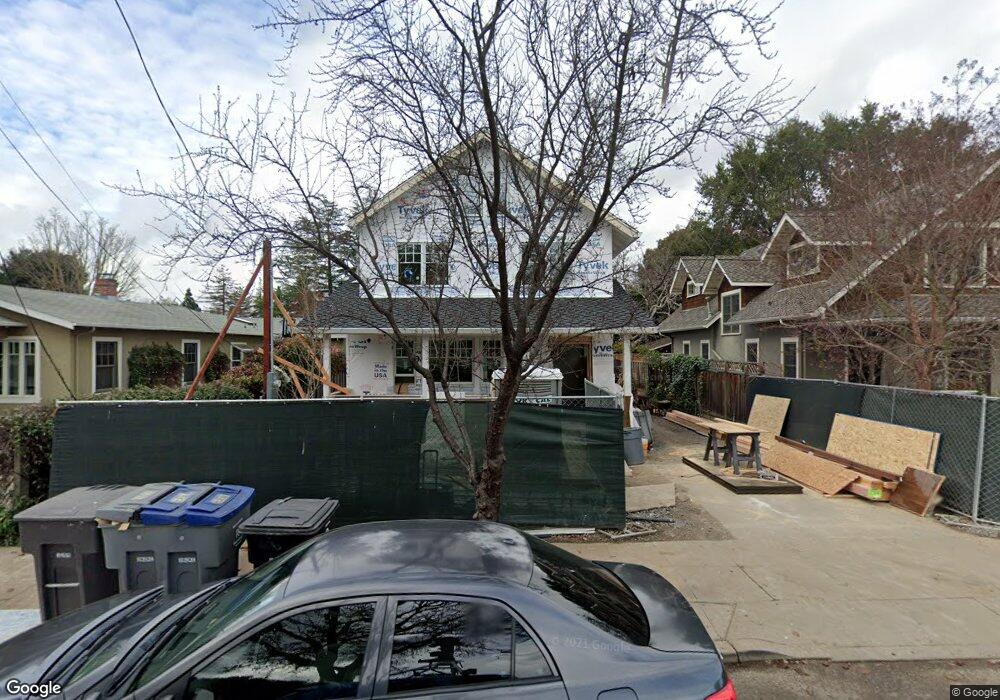
670 Ehrhorn Ave Mountain View, CA 94041
Estimated Value: $1,929,000 - $3,966,000
3
Beds
4
Baths
784
Sq Ft
$4,019/Sq Ft
Est. Value
About This Home
This home is located at 670 Ehrhorn Ave, Mountain View, CA 94041 and is currently estimated at $3,150,514, approximately $4,018 per square foot. 670 Ehrhorn Ave is a home located in Santa Clara County with nearby schools including Edith Landels Elementary School, Isaac Newton Graham Middle School, and Mountain View High School.
Ownership History
Date
Name
Owned For
Owner Type
Purchase Details
Closed on
May 19, 2025
Sold by
Han Steven
Bought by
Steven Han Family Trust and Han
Current Estimated Value
Purchase Details
Closed on
Dec 8, 2009
Sold by
Parks Patrick L
Bought by
Han Steven and Salavatcioglu Yasemin
Home Financials for this Owner
Home Financials are based on the most recent Mortgage that was taken out on this home.
Original Mortgage
$678,400
Interest Rate
4.77%
Mortgage Type
New Conventional
Purchase Details
Closed on
Apr 24, 2007
Sold by
Parks Patrick L
Bought by
Parks Patrick L
Home Financials for this Owner
Home Financials are based on the most recent Mortgage that was taken out on this home.
Original Mortgage
$533,000
Interest Rate
6.12%
Mortgage Type
New Conventional
Purchase Details
Closed on
Oct 18, 2004
Sold by
Parks Patrick
Bought by
Parks Patrick L and Patrick L Parks 2004 Trust
Create a Home Valuation Report for This Property
The Home Valuation Report is an in-depth analysis detailing your home's value as well as a comparison with similar homes in the area
Home Values in the Area
Average Home Value in this Area
Purchase History
| Date | Buyer | Sale Price | Title Company |
|---|---|---|---|
| Steven Han Family Trust | -- | None Listed On Document | |
| Yasemin Han Family Trust | -- | None Listed On Document | |
| Han Steven | -- | Old Republic Title Company | |
| Parks Patrick L | -- | Chicago Title Company | |
| Parks Patrick L | -- | -- |
Source: Public Records
Mortgage History
| Date | Status | Borrower | Loan Amount |
|---|---|---|---|
| Previous Owner | Han Steven | $678,400 | |
| Previous Owner | Parks Patrick L | $533,000 |
Source: Public Records
Tax History Compared to Growth
Tax History
| Year | Tax Paid | Tax Assessment Tax Assessment Total Assessment is a certain percentage of the fair market value that is determined by local assessors to be the total taxable value of land and additions on the property. | Land | Improvement |
|---|---|---|---|---|
| 2025 | $25,847 | $2,256,205 | $968,112 | $1,288,093 |
| 2024 | $25,847 | $2,211,967 | $949,130 | $1,262,837 |
| 2023 | $25,581 | $2,168,596 | $930,520 | $1,238,076 |
| 2022 | $25,512 | $2,126,075 | $912,275 | $1,213,800 |
| 2021 | $24,885 | $2,084,388 | $894,388 | $1,190,000 |
| 2020 | $16,103 | $1,326,398 | $885,218 | $441,180 |
| 2019 | $10,368 | $867,861 | $867,861 | $0 |
| 2018 | $11,569 | $962,018 | $850,845 | $111,173 |
| 2017 | $11,091 | $943,156 | $834,162 | $108,994 |
| 2016 | $10,765 | $924,663 | $817,806 | $106,857 |
| 2015 | $10,455 | $910,774 | $805,522 | $105,252 |
| 2014 | $10,359 | $892,934 | $789,743 | $103,191 |
Source: Public Records
Map
Nearby Homes
- 667 Ehrhorn Ave
- 717 Ehrhorn Ave
- 767 Calderon Ave
- 181 Centre St Unit 29
- 545 Fairmont Ave
- 1059 Nilda Ave
- 148 Mercy St Unit AB
- 42 Church St
- 260 Velarde St
- 269 Bush St Unit C
- 342 Bryant St Unit 15
- 501 Moorpark Way Unit 45
- 191 E El Camino Real Unit 138
- 219 Horizon Ave
- 280 Orchard Ave Unit K
- 268 Andsbury Ave
- 1432 Ernestine Ln
- 139 Easy St
- 1654 Alison Ave
- 0 Elmwood St
- 668 Ehrhorn Ave
- 672 Ehrhorn Ave
- 666 Ehrhorn Ave
- 676 Ehrhorn Ave
- 377 Yosemite Ave
- 686 Ehrhorn Ave
- 664 Ehrhorn Ave
- 791 Shary Ave
- 775 Shary Ave
- 823 Shary Ave
- 696 Ehrhorn Ave
- 662 Ehrhorn Ave
- 757 Shary Ave
- 675 Ehrhorn Ave
- 675 Ehrhorn Ave Unit A
- 681A Ehrhorn Ave
- 675A Ehrhorn Ave
- 847 Shary Ave
- 717 Ehrhorn Ave Unit B
- 717 Ehrhorn Ave Unit A