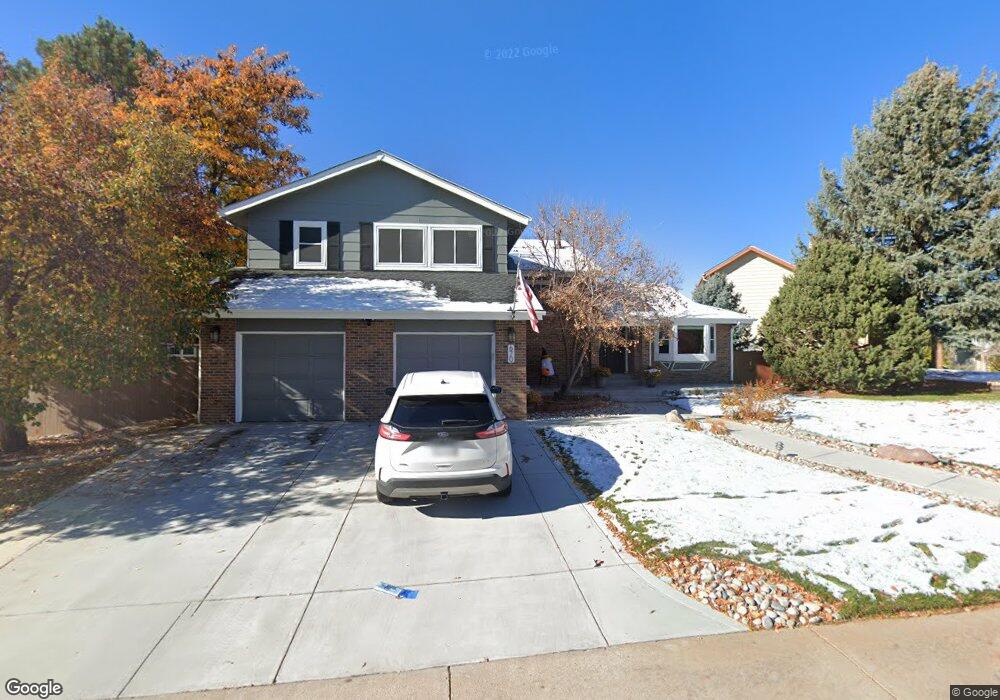
670 Sage Cir Highlands Ranch, CO 80126
Northridge NeighborhoodEstimated Value: $802,000 - $867,334
5
Beds
4
Baths
3,769
Sq Ft
$223/Sq Ft
Est. Value
About This Home
This home is located at 670 Sage Cir, Highlands Ranch, CO 80126 and is currently estimated at $841,584, approximately $223 per square foot. 670 Sage Cir is a home located in Douglas County with nearby schools including Northridge Elementary School, Mountain Ridge Middle School, and Mountain Vista High School.
Ownership History
Date
Name
Owned For
Owner Type
Purchase Details
Closed on
Apr 8, 2022
Sold by
Kearney Niall P
Bought by
Tagami Travis and Tagami Alison
Current Estimated Value
Home Financials for this Owner
Home Financials are based on the most recent Mortgage that was taken out on this home.
Original Mortgage
$850,000
Outstanding Balance
$802,260
Interest Rate
4.72%
Mortgage Type
New Conventional
Estimated Equity
$39,324
Purchase Details
Closed on
Jan 2, 2015
Sold by
Duvall John F and Duvall Sally L
Bought by
Kearney Niall P and Kearney Sheila A
Home Financials for this Owner
Home Financials are based on the most recent Mortgage that was taken out on this home.
Original Mortgage
$373,117
Interest Rate
4.4%
Mortgage Type
FHA
Purchase Details
Closed on
Aug 28, 1995
Sold by
Vanatta Peter W and Vanatta Anna N
Bought by
Duvall John F and Duvall Sally L
Purchase Details
Closed on
Oct 3, 1984
Sold by
Mission Viejo Co
Bought by
Atta Peter W and Atta Ann N Van
Create a Home Valuation Report for This Property
The Home Valuation Report is an in-depth analysis detailing your home's value as well as a comparison with similar homes in the area
Home Values in the Area
Average Home Value in this Area
Purchase History
| Date | Buyer | Sale Price | Title Company |
|---|---|---|---|
| Tagami Travis | $900,000 | New Title Company Name | |
| Kearney Niall P | $380,000 | Fidelity National Title Ins | |
| Duvall John F | $191,000 | -- | |
| Atta Peter W | $169,300 | -- |
Source: Public Records
Mortgage History
| Date | Status | Borrower | Loan Amount |
|---|---|---|---|
| Open | Tagami Travis | $850,000 | |
| Previous Owner | Kearney Niall P | $373,117 |
Source: Public Records
Tax History Compared to Growth
Tax History
| Year | Tax Paid | Tax Assessment Tax Assessment Total Assessment is a certain percentage of the fair market value that is determined by local assessors to be the total taxable value of land and additions on the property. | Land | Improvement |
|---|---|---|---|---|
| 2024 | $5,123 | $58,040 | $10,870 | $47,170 |
| 2023 | $5,114 | $58,040 | $10,870 | $47,170 |
| 2022 | $3,739 | $40,920 | $7,380 | $33,540 |
| 2021 | $3,890 | $40,920 | $7,380 | $33,540 |
| 2020 | $3,579 | $38,590 | $7,080 | $31,510 |
| 2019 | $3,592 | $38,590 | $7,080 | $31,510 |
| 2018 | $3,234 | $34,220 | $6,170 | $28,050 |
| 2017 | $2,945 | $34,220 | $6,170 | $28,050 |
| 2016 | $2,637 | $30,080 | $6,120 | $23,960 |
| 2015 | $2,694 | $30,080 | $6,120 | $23,960 |
| 2014 | $2,401 | $24,750 | $4,940 | $19,810 |
Source: Public Records
Map
Nearby Homes
- 714 Old Stone Dr
- 507 Fox Hunt Cir
- 8822 Eagles Nest Ln
- 904 Fieldstone Place
- 8745 Meadowlark Cir
- 8725 Meadowlark Cir
- 8473 Tanglewood St
- 8606 Meadowlark Cir
- 1384 Briar Cir
- 1241 Northcrest Dr
- 804 Homestead Dr
- 8397 Cobblestone Ct
- 843 Homestead Dr
- 8441 Timberwood St
- 8376 Cobblestone St
- 1186 Cobblestone Dr
- 9050 Hunters Creek St
- 1554 Sunset Ridge Rd
- 1431 Northcrest Dr
- 9191 Hickory Cir