670 W Irving Park Rd Unit G5 Chicago, IL 60613
Buena Park NeighborhoodEstimated Value: $308,000 - $461,000
3
Beds
2
Baths
--
Sq Ft
2.92
Acres
About This Home
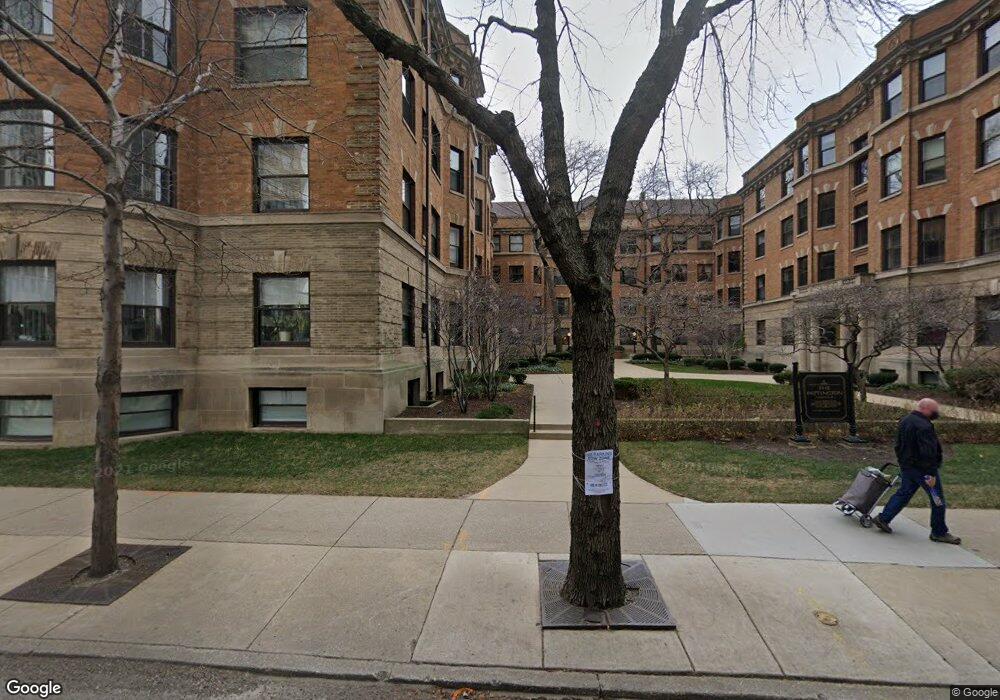
This home is located at 670 W Irving Park Rd Unit G5, Chicago, IL 60613 and is currently estimated at $396,377. 670 W Irving Park Rd Unit G5 is a home located in Cook County with nearby schools including Brennemann Elementary School, Senn High School, and Bernard Zell Anshe Emet Day School.
Ownership History
Date
Name
Owned For
Owner Type
Purchase Details
Closed on
Feb 13, 2013
Sold by
Bryant Betsy and Bryant Kuh Betsy
Bought by
Bryant Betsy
Current Estimated Value
Home Financials for this Owner
Home Financials are based on the most recent Mortgage that was taken out on this home.
Original Mortgage
$84,000
Outstanding Balance
$58,964
Interest Rate
3.5%
Mortgage Type
New Conventional
Estimated Equity
$337,413
Purchase Details
Closed on
Jan 4, 1999
Sold by
Strong Jeffrey S and Strong Brian Calvert
Bought by
Kuh Steven H and Bryant Kuh Betsy
Home Financials for this Owner
Home Financials are based on the most recent Mortgage that was taken out on this home.
Original Mortgage
$186,300
Outstanding Balance
$43,322
Interest Rate
6.79%
Estimated Equity
$353,055
Create a Home Valuation Report for This Property
The Home Valuation Report is an in-depth analysis detailing your home's value as well as a comparison with similar homes in the area
Home Values in the Area
Average Home Value in this Area
Purchase History
| Date | Buyer | Sale Price | Title Company |
|---|---|---|---|
| Bryant Betsy | -- | Old Republic Title | |
| Bryant Kuh Betsy | -- | None Available | |
| Kuh Steven H | $207,000 | 1St American Title |
Source: Public Records
Mortgage History
| Date | Status | Borrower | Loan Amount |
|---|---|---|---|
| Open | Bryant Kuh Betsy | $84,000 | |
| Closed | Bryant Betsy | $84,000 | |
| Open | Kuh Steven H | $186,300 |
Source: Public Records
Tax History Compared to Growth
Tax History
| Year | Tax Paid | Tax Assessment Tax Assessment Total Assessment is a certain percentage of the fair market value that is determined by local assessors to be the total taxable value of land and additions on the property. | Land | Improvement |
|---|---|---|---|---|
| 2024 | $4,364 | $36,200 | $12,766 | $23,434 |
| 2023 | $4,233 | $24,001 | $11,411 | $12,590 |
| 2022 | $4,233 | $24,001 | $11,411 | $12,590 |
| 2021 | $4,156 | $23,999 | $11,410 | $12,589 |
| 2020 | $4,437 | $23,018 | $7,131 | $15,887 |
| 2019 | $4,408 | $25,369 | $7,131 | $18,238 |
| 2018 | $4,333 | $25,369 | $7,131 | $18,238 |
| 2017 | $4,480 | $24,187 | $6,275 | $17,912 |
| 2016 | $4,344 | $24,187 | $6,275 | $17,912 |
| 2015 | $3,951 | $24,187 | $6,275 | $17,912 |
| 2014 | $4,725 | $28,033 | $4,849 | $23,184 |
| 2013 | $3,856 | $23,832 | $4,849 | $18,983 |
Source: Public Records
Map
Nearby Homes
- 707 W Bittersweet Place Unit K2
- 645 W Bittersweet Place Unit 1
- 708 W Bittersweet Place Unit 111
- 700 W Bittersweet Place Unit 904
- 700 W Bittersweet Place Unit 308
- 700 W Bittersweet Place Unit 1004
- 3930 N Pine Grove Ave Unit 1002
- 3930 N Pine Grove Ave Unit 1606
- 3930 N Pine Grove Ave Unit 607
- 3930 N Pine Grove Ave Unit 2313
- 3930 N Pine Grove Ave Unit 2205
- 3930 N Pine Grove Ave Unit 604
- 3930 N Pine Grove Ave Unit 2010
- 3930 N Pine Grove Ave Unit 3009
- 4046 N Clarendon Ave Unit 1S
- 4004 N Clarendon Ave Unit 3
- 4004 N Clarendon Ave Unit 1
- 655 W Irving Park Rd Unit 1911
- 655 W Irving Park Rd Unit 1301
- 655 W Irving Park Rd Unit B-54
- 670 W Irving Park Rd Unit G8
- 670 W Irving Park Rd Unit G7
- 670 W Irving Park Rd Unit 6
- 670 W Irving Park Rd Unit 8
- 672 W Irving Park Rd Unit G3
- 672 W Irving Park Rd Unit G1
- 672 W Irving Park Rd Unit G4
- 672 W Irving Park Rd Unit 2
- 672 W Irving Park Rd Unit 1
- 668 W Irving Park Rd Unit H4
- 668 W Irving Park Rd Unit H3
- 666 W Irving Park Rd Unit I3
- 666 W Irving Park Rd Unit I2
- 666 W Irving Park Rd Unit I1
- 666 W Irving Park Rd Unit I-4
- 674 W Irving Park Rd Unit F6
- 674 W Irving Park Rd Unit F5
- 664 W Irving Park Rd Unit I5
- 664 W Irving Park Rd Unit I6
- 664 W Irving Park Rd Unit I8