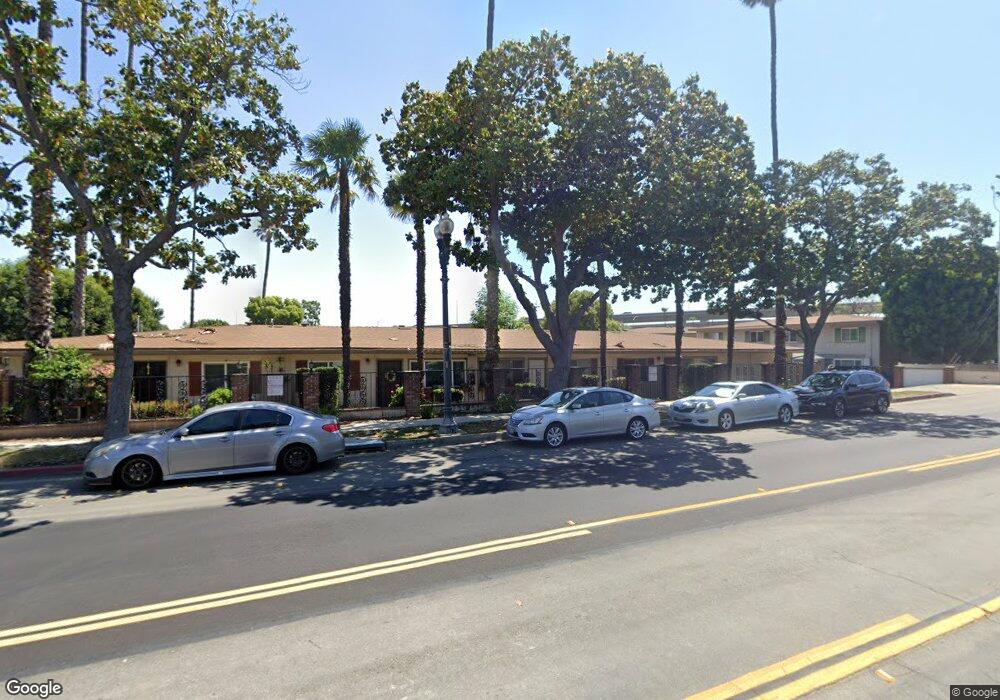
670 W Main St Unit A Tustin, CA 92780
Estimated Value: $522,611 - $648,000
2
Beds
2
Baths
952
Sq Ft
$615/Sq Ft
Est. Value
About This Home
This home is located at 670 W Main St Unit A, Tustin, CA 92780 and is currently estimated at $585,903, approximately $615 per square foot. 670 W Main St Unit A is a home located in Orange County with nearby schools including Helen Estock Elementary School, Columbus Tustin Middle School, and Tustin High School.
Ownership History
Date
Name
Owned For
Owner Type
Purchase Details
Closed on
Sep 12, 2019
Sold by
Soruco Gonzalo F and Soruco Janeth
Bought by
Soruco Gonzalo F and Soruco Janeth
Current Estimated Value
Purchase Details
Closed on
Apr 17, 2001
Sold by
Soruco Gonzalo F
Bought by
Soruco Janeth
Home Financials for this Owner
Home Financials are based on the most recent Mortgage that was taken out on this home.
Original Mortgage
$128,250
Interest Rate
6.98%
Purchase Details
Closed on
Feb 27, 2001
Sold by
Anderson Nels A and Anderson Gull Britt L
Bought by
Soruco Janeth
Home Financials for this Owner
Home Financials are based on the most recent Mortgage that was taken out on this home.
Original Mortgage
$128,250
Interest Rate
6.98%
Purchase Details
Closed on
Jan 30, 1998
Sold by
Jeanette Sjoholm
Bought by
Anderson Nels A and Anderson Gull Britt L
Create a Home Valuation Report for This Property
The Home Valuation Report is an in-depth analysis detailing your home's value as well as a comparison with similar homes in the area
Home Values in the Area
Average Home Value in this Area
Purchase History
| Date | Buyer | Sale Price | Title Company |
|---|---|---|---|
| Soruco Gonzalo F | -- | Accommodation | |
| Soruco Janeth | -- | -- | |
| Soruco Janeth | $135,500 | -- | |
| Anderson Nels A | -- | -- |
Source: Public Records
Mortgage History
| Date | Status | Borrower | Loan Amount |
|---|---|---|---|
| Previous Owner | Soruco Janeth | $128,250 |
Source: Public Records
Tax History Compared to Growth
Tax History
| Year | Tax Paid | Tax Assessment Tax Assessment Total Assessment is a certain percentage of the fair market value that is determined by local assessors to be the total taxable value of land and additions on the property. | Land | Improvement |
|---|---|---|---|---|
| 2025 | $2,653 | $204,165 | $134,811 | $69,354 |
| 2024 | $2,653 | $200,162 | $132,167 | $67,995 |
| 2023 | $2,579 | $196,238 | $129,576 | $66,662 |
| 2022 | $2,529 | $192,391 | $127,036 | $65,355 |
| 2021 | $2,482 | $188,619 | $124,545 | $64,074 |
| 2020 | $2,468 | $186,685 | $123,268 | $63,417 |
| 2019 | $2,416 | $183,025 | $120,851 | $62,174 |
| 2018 | $2,379 | $179,437 | $118,482 | $60,955 |
| 2017 | $2,340 | $175,919 | $116,159 | $59,760 |
| 2016 | $2,301 | $172,470 | $113,881 | $58,589 |
| 2015 | $2,389 | $169,880 | $112,171 | $57,709 |
| 2014 | $2,333 | $166,553 | $109,974 | $56,579 |
Source: Public Records
Map
Nearby Homes
- 654 W Main St Unit B
- 631 W 6th St Unit D
- 155 Pasadena Ave
- 141 E Coronado Ln
- 157 Pacific St
- 158 E De Anza Ln Unit 175
- 15500 Tustin Village Way Unit 15
- 16667 Montego Way
- 129 Colombo Ln
- 131 Colombo Ln
- 107 S Portola Ln Unit 41
- 1006 Overton Ct
- 124 Balboa Ln
- 16596 Alliance Ave
- 160 N B St
- 1882 E 1st St Unit 260
- 1818 E 1st St Unit 520
- Plan 3 at Cabrillo Crossing
- Plan 1 at Cabrillo Crossing
- Plan 4 at Cabrillo Crossing
- 670 W Main St Unit C
- 670 W Main St Unit B
- 670 W Main St Unit D
- 674 W Main St Unit C
- 674 W Main St Unit A
- 674 W Main St Unit D
- 674 W Main St Unit B
- 672 W Main St Unit D
- 672 W Main St Unit A
- 672 W Main St Unit C
- 672 W Main St Unit B
- 680 W Main St Unit A
- 680 W Main St Unit D
- 680 W Main St Unit C
- 664 W Main St Unit 45
- 664 W Main St Unit B
- 664 W Main St Unit C
- 664 W Main St Unit A
- 664 W Main St Unit D
- 676 W Main St Unit B