
Last list price
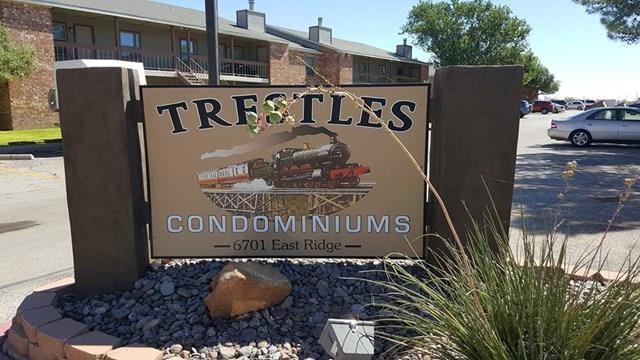
6701 Eastridge Rd Odessa, TX 79762
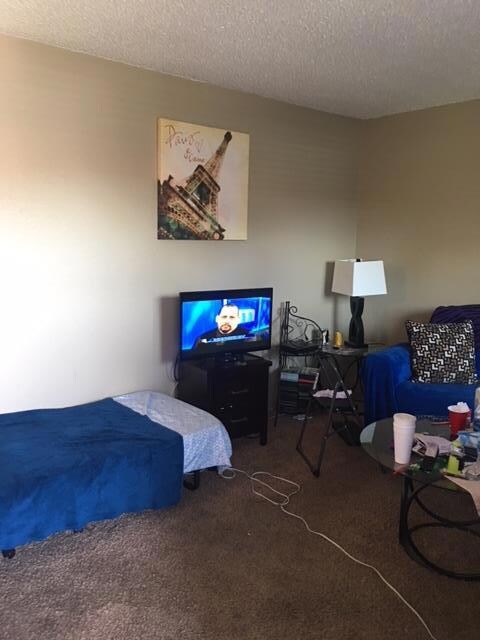
1
Bed
1
Bath
476
Sq Ft
$75/mo
HOA Fee
Highlights
- In Ground Pool
- Brick Veneer
- Landscaped
- Covered patio or porch
- Low Maintenance Yard
- Central Heating and Cooling System
About This Home
As of April 2025Great Location for Midland/Odessa with easy access to Hwy 191. Perfect income producing rental for Investors or great easy living for anyone. Downstairs Unit with access to pool, playground, tennis courts.
Townhouse Details
Home Type
- Townhome
Est. Annual Taxes
- $922
Year Built
- Built in 1983
Lot Details
- 1,468 Sq Ft Lot
- Landscaped
- Low Maintenance Yard
HOA Fees
- $75 Monthly HOA Fees
Home Design
- Brick Veneer
- Slab Foundation
- Composition Roof
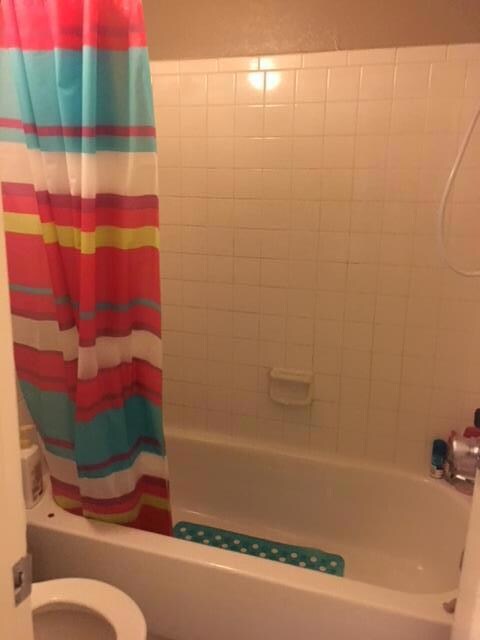
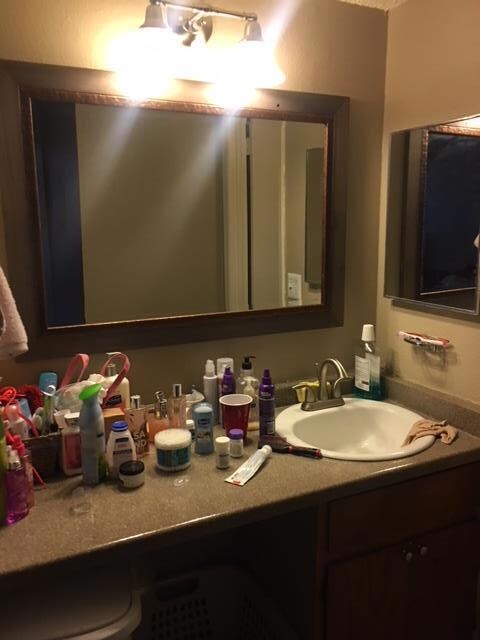
Interior Spaces
- 476 Sq Ft Home
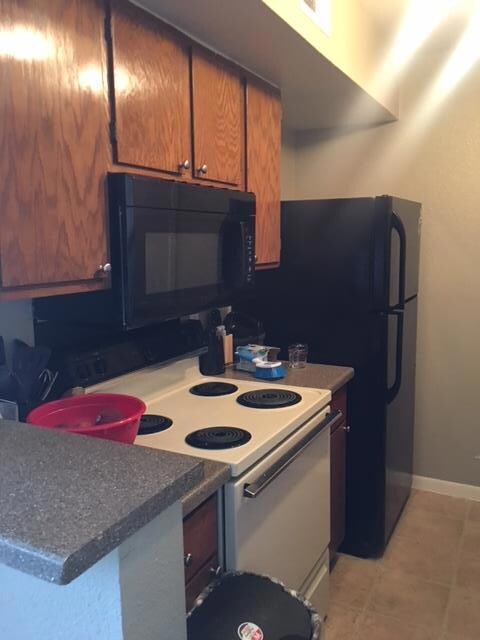
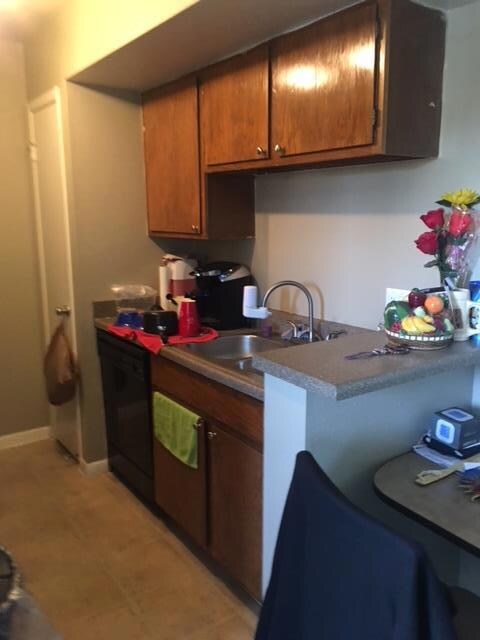
- Combination Kitchen and Dining Room
- <<microwave>>
Flooring
- Carpet
- Vinyl
Bedrooms and Bathrooms
- 1 Bedroom
- 1 Full Bathroom
Home Security
Outdoor Features
- In Ground Pool
- Covered patio or porch
Schools
- Johnson Elementary School
- Bonham Middle School
- Permian High School
Utilities
- Central Heating and Cooling System
Community Details
Overview
- Eastridge Subdivision
Security
- Fire and Smoke Detector
Similar Homes in Odessa, TX
Create a Home Valuation Report for This Property
The Home Valuation Report is an in-depth analysis detailing your home's value as well as a comparison with similar homes in the area
Home Values in the Area
Average Home Value in this Area
Property History
| Date | Event | Price | Change | Sq Ft Price |
|---|---|---|---|---|
| 07/02/2025 07/02/25 | Price Changed | $1,800 | -10.0% | $2 / Sq Ft |
| 06/12/2025 06/12/25 | For Rent | $2,000 | 0.0% | -- |
| 04/16/2025 04/16/25 | Sold | -- | -- | -- |
| 03/23/2025 03/23/25 | Pending | -- | -- | -- |
| 03/21/2025 03/21/25 | For Sale | $105,000 | 0.0% | $122 / Sq Ft |
| 03/04/2024 03/04/24 | Rented | -- | -- | -- |
| 01/29/2024 01/29/24 | For Rent | $1,400 | +64.7% | -- |
| 01/25/2024 01/25/24 | Price Changed | $850 | -39.3% | $2 / Sq Ft |
| 10/25/2023 10/25/23 | Rented | -- | -- | -- |
| 09/06/2023 09/06/23 | For Rent | $1,400 | +86.7% | -- |
| 07/13/2023 07/13/23 | For Rent | $750 | 0.0% | -- |
| 05/24/2023 05/24/23 | Price Changed | $750 | -99.4% | $2 / Sq Ft |
| 05/07/2023 05/07/23 | Rented | -- | -- | -- |
| 04/27/2023 04/27/23 | Sold | -- | -- | -- |
| 04/14/2023 04/14/23 | Pending | -- | -- | -- |
| 04/04/2023 04/04/23 | For Sale | $125,000 | 0.0% | $145 / Sq Ft |
| 03/02/2023 03/02/23 | Price Changed | $1,400 | -6.7% | $3 / Sq Ft |
| 01/12/2023 01/12/23 | For Rent | $1,500 | +114.3% | -- |
| 10/11/2022 10/11/22 | Price Changed | $700 | +16.7% | $1 / Sq Ft |
| 08/23/2022 08/23/22 | For Rent | $600 | -99.4% | -- |
| 07/09/2021 07/09/21 | For Rent | -- | -- | -- |
| 07/09/2021 07/09/21 | Rented | -- | -- | -- |
| 06/17/2021 06/17/21 | Rented | -- | -- | -- |
| 05/18/2021 05/18/21 | Under Contract | -- | -- | -- |
| 04/01/2021 04/01/21 | Sold | -- | -- | -- |
| 02/20/2021 02/20/21 | Rented | -- | -- | -- |
| 02/19/2021 02/19/21 | Pending | -- | -- | -- |
| 01/21/2021 01/21/21 | Under Contract | -- | -- | -- |
| 01/19/2021 01/19/21 | For Rent | -- | -- | -- |
| 12/27/2020 12/27/20 | Rented | -- | -- | -- |
| 12/18/2020 12/18/20 | For Sale | $105,000 | +40.0% | $122 / Sq Ft |
| 12/10/2020 12/10/20 | Sold | -- | -- | -- |
| 11/27/2020 11/27/20 | Under Contract | -- | -- | -- |
| 11/24/2020 11/24/20 | Pending | -- | -- | -- |
| 10/13/2020 10/13/20 | Sold | -- | -- | -- |
| 10/13/2020 10/13/20 | For Sale | $75,000 | 0.0% | $118 / Sq Ft |
| 09/16/2020 09/16/20 | For Rent | -- | -- | -- |
| 09/11/2020 09/11/20 | Sold | -- | -- | -- |
| 09/11/2020 09/11/20 | Pending | -- | -- | -- |
| 08/05/2020 08/05/20 | Pending | -- | -- | -- |
| 07/23/2020 07/23/20 | Rented | -- | -- | -- |
| 06/30/2020 06/30/20 | Sold | -- | -- | -- |
| 06/23/2020 06/23/20 | Under Contract | -- | -- | -- |
| 05/29/2020 05/29/20 | Pending | -- | -- | -- |
| 04/06/2020 04/06/20 | Rented | -- | -- | -- |
| 03/07/2020 03/07/20 | Under Contract | -- | -- | -- |
| 02/19/2020 02/19/20 | Sold | -- | -- | -- |
| 02/10/2020 02/10/20 | For Rent | -- | -- | -- |
| 02/04/2020 02/04/20 | Sold | -- | -- | -- |
| 02/03/2020 02/03/20 | For Sale | $74,000 | +0.3% | $155 / Sq Ft |
| 01/17/2020 01/17/20 | Pending | -- | -- | -- |
| 12/30/2019 12/30/19 | Pending | -- | -- | -- |
| 12/10/2019 12/10/19 | Sold | -- | -- | -- |
| 12/05/2019 12/05/19 | For Sale | $73,800 | 0.0% | $155 / Sq Ft |
| 12/03/2019 12/03/19 | For Rent | -- | -- | -- |
| 12/03/2019 12/03/19 | For Rent | -- | -- | -- |
| 12/03/2019 12/03/19 | Rented | -- | -- | -- |
| 10/30/2019 10/30/19 | For Sale | $75,000 | -34.7% | $158 / Sq Ft |
| 10/11/2019 10/11/19 | For Sale | $114,900 | +47.3% | $133 / Sq Ft |
| 10/07/2019 10/07/19 | Pending | -- | -- | -- |
| 08/14/2019 08/14/19 | For Sale | $78,000 | 0.0% | $164 / Sq Ft |
| 08/07/2019 08/07/19 | For Sale | $78,000 | +13.0% | $164 / Sq Ft |
| 07/31/2019 07/31/19 | Sold | -- | -- | -- |
| 06/10/2019 06/10/19 | Pending | -- | -- | -- |
| 06/06/2019 06/06/19 | For Rent | -- | -- | -- |
| 06/06/2019 06/06/19 | Rented | -- | -- | -- |
| 05/21/2019 05/21/19 | For Sale | $69,000 | +1.5% | $145 / Sq Ft |
| 03/21/2019 03/21/19 | Sold | -- | -- | -- |
| 03/08/2019 03/08/19 | Pending | -- | -- | -- |
| 03/08/2019 03/08/19 | For Sale | $68,000 | +4.6% | $143 / Sq Ft |
| 12/06/2018 12/06/18 | Sold | -- | -- | -- |
| 11/16/2018 11/16/18 | For Rent | -- | -- | -- |
| 11/15/2018 11/15/18 | Rented | -- | -- | -- |
| 11/12/2018 11/12/18 | Pending | -- | -- | -- |
| 10/16/2018 10/16/18 | Under Contract | -- | -- | -- |
| 09/13/2018 09/13/18 | For Sale | $65,000 | -15.0% | $137 / Sq Ft |
| 09/06/2018 09/06/18 | Sold | -- | -- | -- |
| 08/23/2018 08/23/18 | Pending | -- | -- | -- |
| 06/26/2018 06/26/18 | For Rent | -- | -- | -- |
| 03/28/2018 03/28/18 | For Sale | $76,500 | -1.9% | $161 / Sq Ft |
| 01/30/2018 01/30/18 | Sold | -- | -- | -- |
| 01/10/2018 01/10/18 | Pending | -- | -- | -- |
| 12/25/2017 12/25/17 | For Sale | $78,000 | +30.0% | $90 / Sq Ft |
| 09/27/2017 09/27/17 | Sold | -- | -- | -- |
| 09/09/2017 09/09/17 | Pending | -- | -- | -- |
| 08/02/2017 08/02/17 | For Sale | $60,000 | +42.9% | $94 / Sq Ft |
| 07/13/2017 07/13/17 | Sold | -- | -- | -- |
| 06/29/2017 06/29/17 | Pending | -- | -- | -- |
| 06/12/2017 06/12/17 | Sold | -- | -- | -- |
| 06/03/2017 06/03/17 | Pending | -- | -- | -- |
| 05/18/2017 05/18/17 | For Sale | $42,000 | -50.6% | $88 / Sq Ft |
| 04/28/2017 04/28/17 | For Sale | $85,000 | +41.9% | $98 / Sq Ft |
| 12/15/2016 12/15/16 | Sold | -- | -- | -- |
| 11/29/2016 11/29/16 | Pending | -- | -- | -- |
| 09/07/2016 09/07/16 | Sold | -- | -- | -- |
| 08/27/2016 08/27/16 | Pending | -- | -- | -- |
| 08/05/2016 08/05/16 | Rented | -- | -- | -- |
| 08/01/2016 08/01/16 | For Sale | $59,900 | 0.0% | $126 / Sq Ft |
| 07/06/2016 07/06/16 | Under Contract | -- | -- | -- |
| 06/22/2016 06/22/16 | For Sale | $59,900 | -20.8% | $126 / Sq Ft |
| 06/14/2016 06/14/16 | Sold | -- | -- | -- |
| 05/08/2016 05/08/16 | Pending | -- | -- | -- |
| 05/03/2016 05/03/16 | For Rent | -- | -- | -- |
| 04/01/2016 04/01/16 | For Sale | $75,600 | 0.0% | $88 / Sq Ft |
| 03/12/2016 03/12/16 | Rented | -- | -- | -- |
| 02/11/2016 02/11/16 | Under Contract | -- | -- | -- |
| 02/10/2016 02/10/16 | For Rent | -- | -- | -- |
| 12/10/2015 12/10/15 | Sold | -- | -- | -- |
| 11/16/2015 11/16/15 | Pending | -- | -- | -- |
| 10/28/2015 10/28/15 | For Sale | $54,500 | 0.0% | $114 / Sq Ft |
| 08/03/2015 08/03/15 | Rented | -- | -- | -- |
| 07/04/2015 07/04/15 | Under Contract | -- | -- | -- |
| 06/19/2015 06/19/15 | For Rent | -- | -- | -- |
| 11/26/2013 11/26/13 | Sold | -- | -- | -- |
| 11/08/2013 11/08/13 | Sold | -- | -- | -- |
| 10/24/2013 10/24/13 | Pending | -- | -- | -- |
| 10/16/2013 10/16/13 | Pending | -- | -- | -- |
| 10/16/2013 10/16/13 | For Sale | $50,000 | +6.4% | $105 / Sq Ft |
| 10/09/2013 10/09/13 | Sold | -- | -- | -- |
| 08/21/2013 08/21/13 | Pending | -- | -- | -- |
| 08/15/2013 08/15/13 | For Sale | $47,000 | -21.7% | $99 / Sq Ft |
| 02/17/2013 02/17/13 | For Sale | $60,000 | +14.3% | $94 / Sq Ft |
| 01/09/2012 01/09/12 | Sold | -- | -- | -- |
| 12/26/2011 12/26/11 | Pending | -- | -- | -- |
| 11/01/2011 11/01/11 | For Sale | $52,500 | -- | $61 / Sq Ft |
Source: Odessa Board of REALTORS®
Tax History Compared to Growth
Tax History
| Year | Tax Paid | Tax Assessment Tax Assessment Total Assessment is a certain percentage of the fair market value that is determined by local assessors to be the total taxable value of land and additions on the property. | Land | Improvement |
|---|---|---|---|---|
| 2024 | $2,056 | $97,503 | $13,578 | $83,925 |
| 2023 | $2,056 | $103,959 | $13,578 | $90,381 |
| 2022 | $2,568 | $111,163 | $7,732 | $103,431 |
| 2021 | $2,528 | $107,177 | $7,726 | $99,451 |
| 2020 | $2,485 | $107,177 | $7,726 | $99,451 |
| 2019 | $2,604 | $105,611 | $7,726 | $97,885 |
| 2018 | $1,828 | $77,644 | $7,726 | $69,918 |
| 2017 | $1,722 | $75,604 | $7,726 | $67,878 |
| 2016 | $1,679 | $75,604 | $7,726 | $67,878 |
| 2015 | $1,034 | $75,604 | $7,726 | $67,878 |
| 2014 | $1,034 | $77,760 | $7,726 | $70,034 |
Source: Public Records
Agents Affiliated with this Home
-
Caroline Poer
Seller's Agent in 2025
Caroline Poer
TRUDY THOMASON REALTY, INC.
(432) 210-2340
41 Total Sales
-
Keri Taylor
K
Seller's Agent in 2025
Keri Taylor
Nicole Howsey Realtors LLC
(432) 528-8038
40 Total Sales
-
Stacey James
Seller's Agent in 2024
Stacey James
The Real Estate Group
(432) 296-1599
161 Total Sales
-
Tania Saldana
T
Buyer's Agent in 2023
Tania Saldana
Keller Williams Realty - Midland & Odessa
(832) 235-4995
8 Total Sales
-
Cameron Willmann
Seller's Agent in 2021
Cameron Willmann
Keller Williams Realty - Midland & Odessa
(432) 978-4298
43 Total Sales
-
Jami Martinez
J
Buyer's Agent in 2021
Jami Martinez
Home Team Real Estate
(432) 664-2300
6 Total Sales
Map
Source: Odessa Board of REALTORS®
MLS Number: 108086
APN: 08960-01250-00000
Nearby Homes
- 6701 Eastridge Rd Unit 1322
- 6701 Eastridge Rd Unit 905
- 6701 Eastridge Rd Unit 1122
- 7 Amethyst Cove
- 39 Amethyst Cove
- 6450 E Highway 191
- 6409 Mecca St
- 3315 Emerald Oaks Ln
- 3311 Emerald Oaks Dr
- 6415 San Mateo Ln
- 3309 Emerald Oaks Dr
- 3309 Emerald Oaks Ln
- 3307 Emerald Oaks Ln
- 3307 Emerald Oaks Dr
- 6338 Mecca St
- 6413 Piedmont St
- 40 Muirfield Dr
- 6405 Piedmont St
- 3320 Trails End Rd
- 7013 Fasken Rd