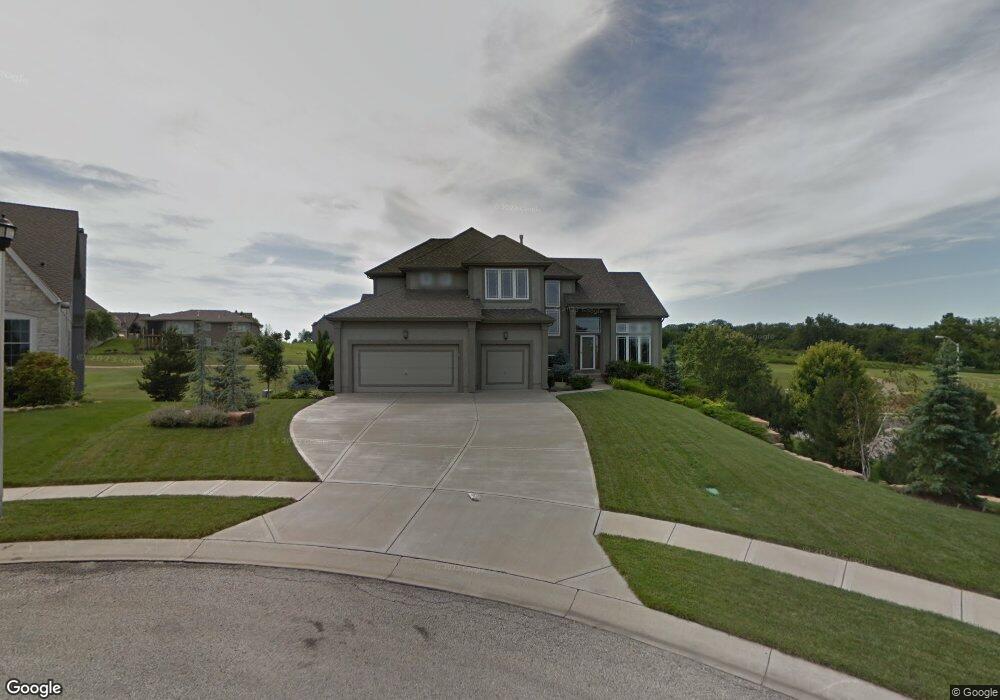
6702 Barth Rd Shawnee, KS 66226
Estimated Value: $689,632 - $777,000
4
Beds
4
Baths
3,490
Sq Ft
$212/Sq Ft
Est. Value
About This Home
This home is located at 6702 Barth Rd, Shawnee, KS 66226 and is currently estimated at $738,658, approximately $211 per square foot. 6702 Barth Rd is a home located in Johnson County with nearby schools including Mize Elementary School, Mill Creek Middle School, and De Soto High School.
Ownership History
Date
Name
Owned For
Owner Type
Purchase Details
Closed on
Jul 10, 2009
Sold by
Blue Valley Investment Corporation
Bought by
Clauser David C
Current Estimated Value
Home Financials for this Owner
Home Financials are based on the most recent Mortgage that was taken out on this home.
Original Mortgage
$333,483
Outstanding Balance
$209,331
Interest Rate
4.97%
Mortgage Type
Purchase Money Mortgage
Estimated Equity
$529,327
Purchase Details
Closed on
Jan 31, 2008
Sold by
Janrick Inc
Bought by
Blue Valley Investment Co
Purchase Details
Closed on
Apr 28, 2005
Sold by
Cp Investments Llc
Bought by
Jenrick Inc
Home Financials for this Owner
Home Financials are based on the most recent Mortgage that was taken out on this home.
Original Mortgage
$390,000
Interest Rate
5.93%
Mortgage Type
Construction
Create a Home Valuation Report for This Property
The Home Valuation Report is an in-depth analysis detailing your home's value as well as a comparison with similar homes in the area
Home Values in the Area
Average Home Value in this Area
Purchase History
| Date | Buyer | Sale Price | Title Company |
|---|---|---|---|
| Clauser David C | $374,700 | Chicago Title Ins Co | |
| Blue Valley Investment Co | -- | Chicago Title Insurnce Co | |
| Jenrick Inc | -- | None Available |
Source: Public Records
Mortgage History
| Date | Status | Borrower | Loan Amount |
|---|---|---|---|
| Open | Clauser David C | $333,483 | |
| Previous Owner | Jenrick Inc | $390,000 |
Source: Public Records
Tax History
| Year | Tax Paid | Tax Assessment Tax Assessment Total Assessment is a certain percentage of the fair market value that is determined by local assessors to be the total taxable value of land and additions on the property. | Land | Improvement |
|---|---|---|---|---|
| 2025 | $7,985 | $66,769 | $17,747 | $49,022 |
| 2024 | $7,985 | $68,310 | $17,747 | $50,563 |
| 2023 | $7,511 | $63,802 | $15,430 | $48,372 |
| 2022 | $7,275 | $60,547 | $16,232 | $44,315 |
| 2021 | $6,818 | $54,694 | $16,232 | $38,462 |
| 2020 | $7,058 | $56,120 | $16,232 | $39,888 |
| 2019 | $6,704 | $52,520 | $11,272 | $41,248 |
| 2018 | $6,763 | $52,520 | $11,272 | $41,248 |
| 2017 | $6,724 | $50,945 | $10,251 | $40,694 |
| 2016 | $6,724 | $50,324 | $10,251 | $40,073 |
| 2015 | $6,711 | $49,208 | $10,251 | $38,957 |
| 2013 | -- | $44,976 | $10,251 | $34,725 |
Source: Public Records
Map
Nearby Homes
- 6626 Mccormick Dr
- 24203 W 69th St
- 7005 Barth Rd
- 23300 W 71st St
- 6001 Hedge Lane Terrace
- 6000 Hedge Lane Terrace
- 7132 Hedge Lane Terrace
- 7134 Hedge Lane Terrace
- 7156 Hedge Lane Terrace
- 23217 W 71st Terrace
- 7135 Meadow View St
- 23826 Clear Creek Pkwy
- 23154 W 71st Terrace
- 23136 W 71st Terrace
- 6022 Apache Dr
- 6010 Apache Dr
- 26775 W 73rd St
- 6005 Arapahoe St
- 6024 Arapahoe St
- LOT 2 65th & Mize Rd
- 6706 Barth Rd
- 6630 Barth Rd
- 6617 Barth Rd
- 6710 Barth Rd
- 23929 W 66th St
- 6705 Barth Rd
- 23917 W 66th St
- 6615 Barth Rd
- 6705 Mccormick Dr
- 6714 Barth Rd
- 23927 W 66th St
- 6701 Mccormick Dr
- 6614 Barth Rd
- 6709 Barth Rd
- 6709 Mccormick Dr
- 23921 W 66th St
- 23911 W 66th St
- 23915 W 66th St
- 6713 Mccormick Dr
- 6616 Barth Rd
Your Personal Tour Guide
Ask me questions while you tour the home.