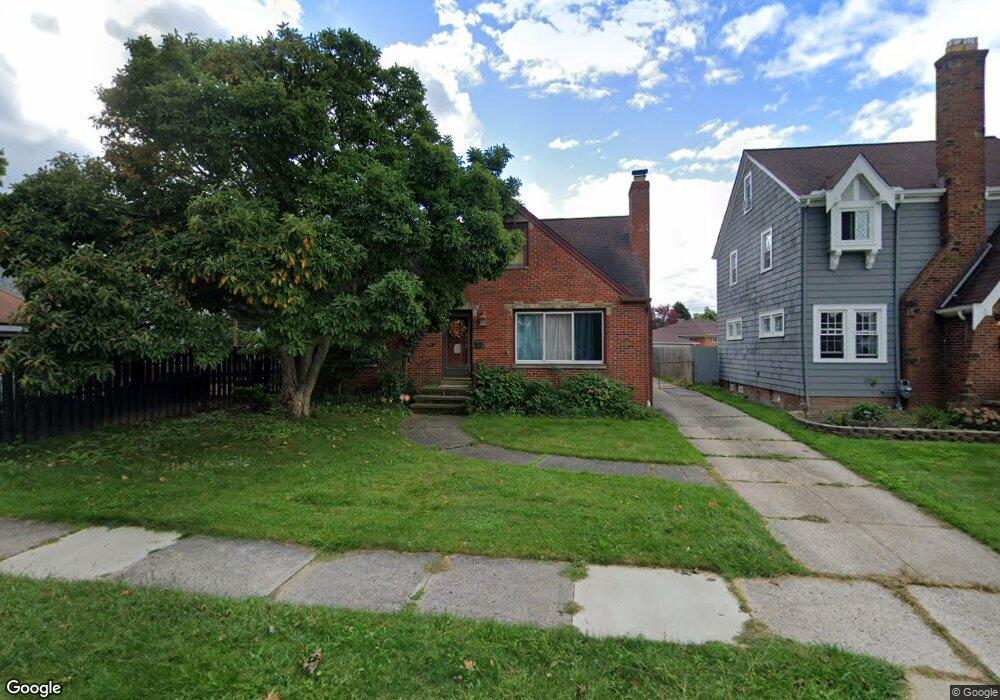
6703 Southington Dr Cleveland, OH 44129
Estimated Value: $184,000 - $202,000
2
Beds
1
Bath
1,026
Sq Ft
$188/Sq Ft
Est. Value
About This Home
This home is located at 6703 Southington Dr, Cleveland, OH 44129 and is currently estimated at $192,504, approximately $187 per square foot. 6703 Southington Dr is a home located in Cuyahoga County with nearby schools including Renwood Elementary School, Hillside Middle School, and Parma High School.
Ownership History
Date
Name
Owned For
Owner Type
Purchase Details
Closed on
Dec 3, 2018
Sold by
Hoherz Richard and Hoherz Leeann
Bought by
Graboswski Lara E
Current Estimated Value
Purchase Details
Closed on
Jul 19, 2001
Sold by
Paul Kraus
Bought by
Hoherz Richard and Hoherz Leeann
Home Financials for this Owner
Home Financials are based on the most recent Mortgage that was taken out on this home.
Original Mortgage
$110,000
Interest Rate
7.16%
Purchase Details
Closed on
Jul 1, 1987
Sold by
Laszlo Frank
Bought by
Kraus Paul
Purchase Details
Closed on
Nov 9, 1976
Sold by
Kretchman Wanda
Bought by
Laszlo Frank
Purchase Details
Closed on
Sep 2, 1976
Sold by
Kretchman Edward and Kretchman Wanda
Bought by
Kretchman Wanda
Purchase Details
Closed on
Jan 1, 1975
Bought by
Kretchman Edward and Kretchman Wanda
Create a Home Valuation Report for This Property
The Home Valuation Report is an in-depth analysis detailing your home's value as well as a comparison with similar homes in the area
Home Values in the Area
Average Home Value in this Area
Purchase History
| Date | Buyer | Sale Price | Title Company |
|---|---|---|---|
| Graboswski Lara E | $86,300 | None Available | |
| Hoherz Richard | $137,000 | Ctic | |
| Kraus Paul | $56,000 | -- | |
| Laszlo Frank | $43,500 | -- | |
| Kretchman Wanda | -- | -- | |
| Kretchman Edward | -- | -- |
Source: Public Records
Mortgage History
| Date | Status | Borrower | Loan Amount |
|---|---|---|---|
| Previous Owner | Hoherz Richard | $110,000 |
Source: Public Records
Tax History Compared to Growth
Tax History
| Year | Tax Paid | Tax Assessment Tax Assessment Total Assessment is a certain percentage of the fair market value that is determined by local assessors to be the total taxable value of land and additions on the property. | Land | Improvement |
|---|---|---|---|---|
| 2024 | $3,533 | $57,540 | $13,370 | $44,170 |
| 2023 | $3,259 | $45,820 | $11,830 | $33,990 |
| 2022 | $3,229 | $45,815 | $11,830 | $33,985 |
| 2021 | $3,321 | $45,820 | $11,830 | $33,990 |
| 2020 | $2,909 | $35,250 | $9,100 | $26,150 |
| 2019 | $2,788 | $100,700 | $26,000 | $74,700 |
| 2018 | $2,804 | $35,250 | $9,100 | $26,150 |
| 2017 | $2,589 | $30,210 | $6,690 | $23,520 |
| 2016 | $2,573 | $30,210 | $6,690 | $23,520 |
| 2015 | $2,465 | $30,210 | $6,690 | $23,520 |
| 2014 | $2,465 | $30,840 | $6,830 | $24,010 |
Source: Public Records
Map
Nearby Homes
- 6510 Belmere Dr
- 6921 Hollywood Dr
- 6298 Chestnut Hills Dr
- 6234 N Canterbury Rd
- 6227 Ridge Rd
- 6701 Pelham Dr
- 6474 Ridge Rd
- 5700 Hollywood Dr
- 6485 Buckingham Dr
- 6430 Monmouth Dr
- 6439 Keltonshire Rd
- 6111 Manchester Rd
- 6136 Ridge Rd
- 6610 Renwood Dr
- 6096 Wareham Dr
- 5415 Pelham Dr
- 6431 W Ridgewood Dr
- 8017 Ackley Rd
- 8017 Wainstead Dr
- 6189 W 54th St
- 6707 Southington Dr
- 6342 Allanwood Dr
- 6336 Allanwood Dr
- 6801 Southington Dr
- 6330 Allanwood Dr
- 6353 Chestnut Hills Dr
- 6361 Chestnut Hills Dr
- 6358 Allanwood Dr
- 6349 Chestnut Hills Dr
- 6805 Southington Dr
- 6367 Chestnut Hills Dr
- 6347 Chestnut Hills Dr
- 6377 Chestnut Hills Dr
- 6702 Southington Dr
- 6612 Southington Dr
- 6708 Southington Dr
- 6608 Southington Dr
- 6800 Southington Dr
- 6379 Chestnut Hills Dr
- 6809 Southington Dr