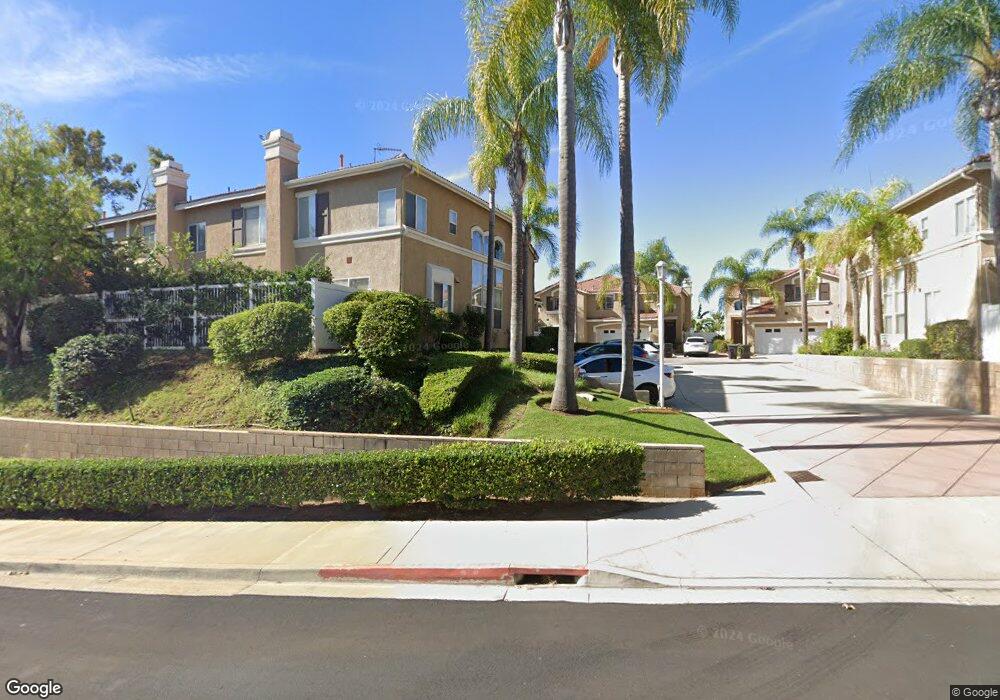
6705 Vista Loma Unit 53 Yorba Linda, CA 92886
Estimated Value: $796,000 - $948,000
3
Beds
2
Baths
1,464
Sq Ft
$582/Sq Ft
Est. Value
About This Home
This home is located at 6705 Vista Loma Unit 53, Yorba Linda, CA 92886 and is currently estimated at $851,784, approximately $581 per square foot. 6705 Vista Loma Unit 53 is a home located in Orange County with nearby schools including Glenknoll Elementary, Bernardo Yorba Middle School, and Ivycrest Montessori Private School - Yorba Linda.
Ownership History
Date
Name
Owned For
Owner Type
Purchase Details
Closed on
Feb 28, 2002
Sold by
White Danny and White Samantha
Bought by
Sakelaris Jerry and Sakelaris Paige
Current Estimated Value
Home Financials for this Owner
Home Financials are based on the most recent Mortgage that was taken out on this home.
Original Mortgage
$219,600
Interest Rate
7.08%
Purchase Details
Closed on
Jan 2, 2002
Sold by
White Samantha and Mitchael Samantha
Bought by
White Danny and White Samantha
Home Financials for this Owner
Home Financials are based on the most recent Mortgage that was taken out on this home.
Original Mortgage
$219,600
Interest Rate
7.08%
Purchase Details
Closed on
Apr 21, 1997
Sold by
Prominence Inc
Bought by
Mitchael Samantha
Home Financials for this Owner
Home Financials are based on the most recent Mortgage that was taken out on this home.
Original Mortgage
$156,729
Interest Rate
7.96%
Mortgage Type
FHA
Create a Home Valuation Report for This Property
The Home Valuation Report is an in-depth analysis detailing your home's value as well as a comparison with similar homes in the area
Home Values in the Area
Average Home Value in this Area
Purchase History
| Date | Buyer | Sale Price | Title Company |
|---|---|---|---|
| Sakelaris Jerry | $274,500 | Lawyers Title Company | |
| White Danny | -- | -- | |
| Mitchael Samantha | $164,500 | Continental Lawyers Title Co |
Source: Public Records
Mortgage History
| Date | Status | Borrower | Loan Amount |
|---|---|---|---|
| Previous Owner | Sakelaris Jerry | $219,600 | |
| Previous Owner | White Danny | $175,000 | |
| Previous Owner | Mitchael Samantha | $156,729 |
Source: Public Records
Tax History Compared to Growth
Tax History
| Year | Tax Paid | Tax Assessment Tax Assessment Total Assessment is a certain percentage of the fair market value that is determined by local assessors to be the total taxable value of land and additions on the property. | Land | Improvement |
|---|---|---|---|---|
| 2025 | $4,760 | $405,509 | $222,932 | $182,577 |
| 2024 | $4,760 | $397,558 | $218,560 | $178,998 |
| 2023 | $4,661 | $389,763 | $214,274 | $175,489 |
| 2022 | $4,606 | $382,121 | $210,072 | $172,049 |
| 2021 | $4,522 | $374,629 | $205,953 | $168,676 |
| 2020 | $4,515 | $370,788 | $203,841 | $166,947 |
| 2019 | $4,363 | $363,518 | $199,844 | $163,674 |
| 2018 | $4,305 | $356,391 | $195,926 | $160,465 |
| 2017 | $4,231 | $349,403 | $192,084 | $157,319 |
| 2016 | $4,143 | $342,552 | $188,317 | $154,235 |
| 2015 | $4,082 | $337,407 | $185,488 | $151,919 |
| 2014 | $3,964 | $330,798 | $181,854 | $148,944 |
Source: Public Records
Map
Nearby Homes
- 6692 Moselle Cir
- 6681 Palma Cir
- 6692 Palma Cir
- 19816 White Spring Ln Unit 36
- 6821 Rocky Grove Ct Unit 13
- 5497 E Willow Woods Ln Unit C
- 5466 E Willow Woods Ln Unit A
- 5815 E La Palma Ave Unit 133
- 5815 E La Palma Ave Unit 190
- 5815 E La Palma Ave Unit 74
- 5455 E Candlewood Cir Unit 61
- 6478 Horse Shoe Ln Unit 9
- 6437 Horse Shoe Ln Unit 2
- 6473 Horse Shoe Ln Unit 6
- 19622 Crestknoll Dr
- 1738 N Cedar Glen Dr Unit B
- 20065 Berkeley Way
- 20267 Clear River Ln Unit 7
- 1726 N Oak Knoll Dr Unit D
- 19931 Crestknoll Dr
- 6699 Vista Loma Unit 7
- 6715 Vista Loma
- 6721 Vista Loma
- 6687 Vista Loma Unit 11
- 6725 Vista Loma
- 6703 Vista Loma Unit 2
- 6701 Vista Loma
- 6735 Vista Loma
- 6685 Vista Loma
- 6691 Vista Loma Unit 10
- 6707 Vista Loma Unit 4
- 6702 Vista Loma
- 6696 Vista Loma
- 6712 Vista Loma
- 6716 Vista Loma
- 6697 Vista Loma Unit 113
- 6692 Vista Loma
- 6693 Vista Loma Unit 9
- 6722 Vista Loma
- 6686 Vista Loma