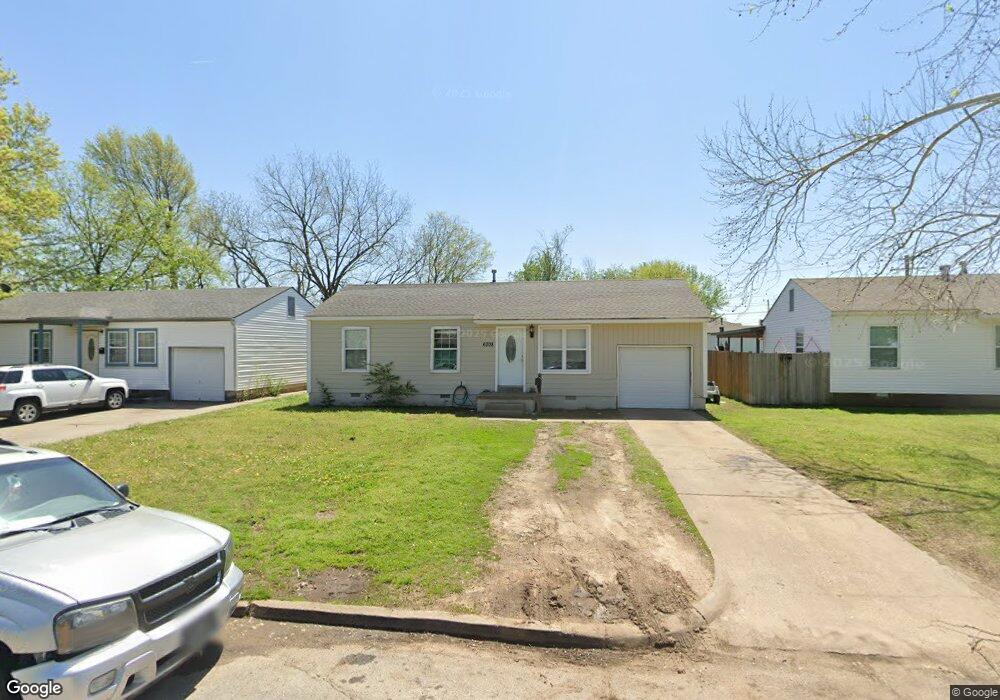
6708 E Haskell Place Tulsa, OK 74115
McKinley Mitchell NeighborhoodEstimated Value: $96,713 - $132,000
3
Beds
1
Bath
888
Sq Ft
$136/Sq Ft
Est. Value
About This Home
This home is located at 6708 E Haskell Place, Tulsa, OK 74115 and is currently estimated at $120,428, approximately $135 per square foot. 6708 E Haskell Place is a home located in Tulsa County with nearby schools including McKinley Elementary School, Nathan Hale High School, and Tulsa Honor Academy Charter.
Ownership History
Date
Name
Owned For
Owner Type
Purchase Details
Closed on
Jun 17, 2014
Sold by
Positive Outlook Properties Llc
Bought by
Serna Ernesto and Serna Martha E
Current Estimated Value
Purchase Details
Closed on
Jun 10, 2014
Sold by
County Of Tulsa
Bought by
Positive Outlook Properties Llc
Purchase Details
Closed on
Oct 10, 2013
Sold by
Burns Carolyn S and Burns Carolyn Susan
Bought by
Probate Services Of Oklahoma Llc
Purchase Details
Closed on
Mar 4, 2005
Sold by
Sund Cynthia and Sund Steven
Bought by
Burns Shon Lee
Home Financials for this Owner
Home Financials are based on the most recent Mortgage that was taken out on this home.
Original Mortgage
$55,800
Interest Rate
8.4%
Mortgage Type
Purchase Money Mortgage
Purchase Details
Closed on
Aug 18, 2004
Sold by
Harris Jerry A and Harris Sally A
Bought by
Sund Cynthia
Purchase Details
Closed on
Jul 1, 1996
Create a Home Valuation Report for This Property
The Home Valuation Report is an in-depth analysis detailing your home's value as well as a comparison with similar homes in the area
Home Values in the Area
Average Home Value in this Area
Purchase History
| Date | Buyer | Sale Price | Title Company |
|---|---|---|---|
| Serna Ernesto | $20,000 | None Available | |
| Positive Outlook Properties Llc | $18,000 | None Available | |
| Probate Services Of Oklahoma Llc | $500 | None Available | |
| Burns Shon Lee | $62,000 | Multiple | |
| Sund Cynthia | $28,500 | -- | |
| -- | $24,000 | -- |
Source: Public Records
Mortgage History
| Date | Status | Borrower | Loan Amount |
|---|---|---|---|
| Previous Owner | Burns Shon Lee | $55,800 |
Source: Public Records
Tax History
| Year | Tax Paid | Tax Assessment Tax Assessment Total Assessment is a certain percentage of the fair market value that is determined by local assessors to be the total taxable value of land and additions on the property. | Land | Improvement |
|---|---|---|---|---|
| 2025 | $544 | $4,062 | $843 | $3,219 |
| 2024 | $468 | $3,869 | $923 | $2,946 |
| 2023 | $468 | $3,685 | $1,011 | $2,674 |
| 2022 | $468 | $3,510 | $1,108 | $2,402 |
| 2021 | $442 | $3,343 | $1,055 | $2,288 |
| 2020 | $415 | $3,184 | $1,005 | $2,179 |
| 2019 | $415 | $3,032 | $957 | $2,075 |
| 2018 | $396 | $2,887 | $911 | $1,976 |
| 2017 | $377 | $2,750 | $1,562 | $1,188 |
| 2016 | $369 | $2,750 | $1,562 | $1,188 |
| 2015 | $370 | $2,750 | $1,562 | $1,188 |
| 2014 | $366 | $2,750 | $1,562 | $1,188 |
Source: Public Records
Map
Nearby Homes
- 6734 E Independence St
- 6710 E Independence Place
- 6763 E Independence Place
- 707 N 71st East Ave
- 848 N 67th East Ave
- 729 N 72nd East Ave
- 524 N Norwood Ave
- 106 S 67th East Ave
- 232 S 69th East Ave
- 7148 E Marshall St
- 6218 E Latimer Place
- 247 S 67th East Ave
- 421 S 69th East Ave
- 424 S 69th East Ave
- 425 S 66th East Ave
- 7348 E Marshall Place
- 6115 E 4th St
- 6329 E 4th Place
- 5934 E 3rd St
- 4307 E 4th Place
- 6712 E Haskell Place
- 6704 E Haskell Place
- 6716 E Haskell Place
- 6725 E Haskell St
- 6715 E Haskell St
- 6720 E Haskell Place
- 6803 E Haskell St
- 6707 E Haskell Place
- 6711 E Haskell Place
- 6703 E Haskell Place
- 6807 E Haskell St
- 6715 E Haskell Place
- 716 N 67th East Ave
- 712 N 67th East Ave
- 6726 E Haskell Place
- 720 N 67th East Ave
- 708 N 67th East Ave
- 6719 E Haskell Place
- 6813 E Haskell St
Your Personal Tour Guide
Ask me questions while you tour the home.