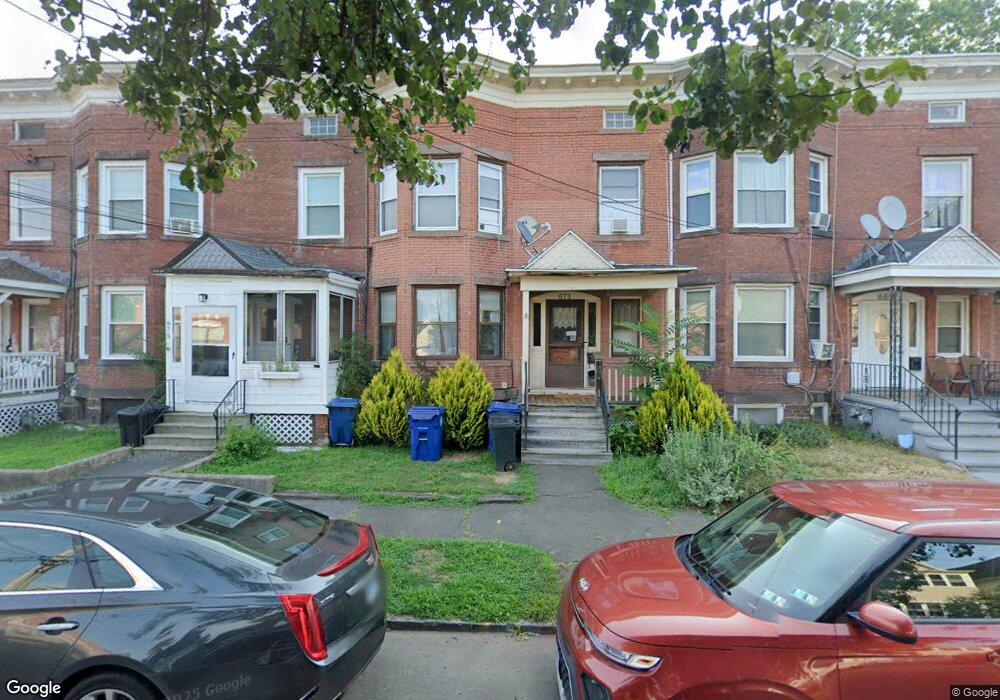
671 3rd Ave West Haven, CT 06516
West Haven Center NeighborhoodEstimated Value: $371,000 - $473,000
1
Bed
1
Bath
1,828
Sq Ft
$228/Sq Ft
Est. Value
About This Home
This home is located at 671 3rd Ave, West Haven, CT 06516 and is currently estimated at $416,667, approximately $227 per square foot. 671 3rd Ave is a home located in New Haven County with nearby schools including Carrigan 5/6 Intermediate School, Harry M. Bailey Middle School, and West Haven High School.
Ownership History
Date
Name
Owned For
Owner Type
Purchase Details
Closed on
Jan 13, 2015
Sold by
Freddie Mac
Bought by
Wan Yang
Current Estimated Value
Purchase Details
Closed on
Oct 16, 2012
Sold by
Manzo Joann M
Bought by
Mad Jo 1 Llc
Purchase Details
Closed on
Apr 4, 1989
Sold by
Agnoletto Peter J
Bought by
Maltese Donna
Create a Home Valuation Report for This Property
The Home Valuation Report is an in-depth analysis detailing your home's value as well as a comparison with similar homes in the area
Home Values in the Area
Average Home Value in this Area
Purchase History
| Date | Buyer | Sale Price | Title Company |
|---|---|---|---|
| Wan Yang | $64,900 | -- | |
| Wan Yang | $64,900 | -- | |
| Mad Jo 1 Llc | -- | -- | |
| Mad Jo 1 Llc | -- | -- | |
| Maltese Donna | $129,900 | -- |
Source: Public Records
Mortgage History
| Date | Status | Borrower | Loan Amount |
|---|---|---|---|
| Previous Owner | Maltese Donna | $31,500 | |
| Previous Owner | Maltese Donna | $31,500 |
Source: Public Records
Tax History Compared to Growth
Tax History
| Year | Tax Paid | Tax Assessment Tax Assessment Total Assessment is a certain percentage of the fair market value that is determined by local assessors to be the total taxable value of land and additions on the property. | Land | Improvement |
|---|---|---|---|---|
| 2025 | $7,611 | $220,430 | $46,690 | $173,740 |
| 2024 | $7,438 | $153,300 | $32,340 | $120,960 |
| 2023 | $7,130 | $153,300 | $32,340 | $120,960 |
| 2022 | $6,990 | $153,300 | $32,340 | $120,960 |
| 2021 | $9,163 | $153,300 | $32,340 | $120,960 |
| 2020 | $5,886 | $116,620 | $25,200 | $91,420 |
| 2019 | $5,676 | $116,620 | $25,200 | $91,420 |
| 2018 | $5,627 | $116,620 | $25,200 | $91,420 |
| 2017 | $8,776 | $116,620 | $25,200 | $91,420 |
| 2016 | $5,313 | $116,620 | $25,200 | $91,420 |
| 2015 | $5,225 | $129,500 | $30,520 | $98,980 |
| 2014 | $5,193 | $129,500 | $30,520 | $98,980 |
Source: Public Records
Map
Nearby Homes