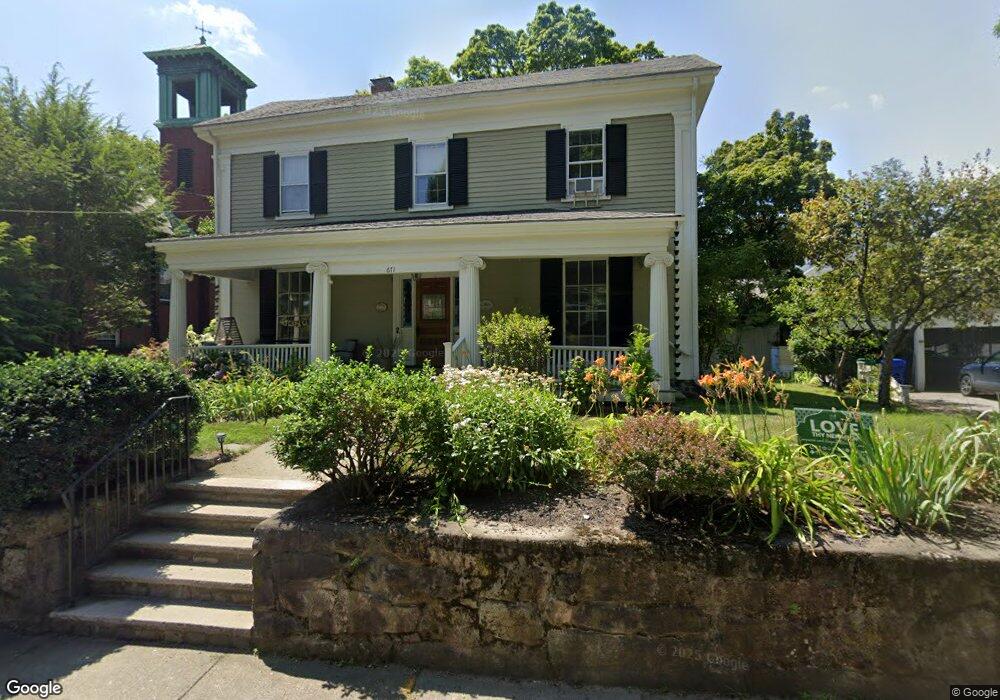
671 Grove St Newton Lower Falls, MA 02462
Newton Lower Falls NeighborhoodEstimated Value: $1,514,000 - $2,398,000
4
Beds
4
Baths
3,252
Sq Ft
$567/Sq Ft
Est. Value
About This Home
This home is located at 671 Grove St, Newton Lower Falls, MA 02462 and is currently estimated at $1,842,591, approximately $566 per square foot. 671 Grove St is a home located in Middlesex County with nearby schools including Angier Elementary School, Charles E Brown Middle School, and Newton South High School.
Ownership History
Date
Name
Owned For
Owner Type
Purchase Details
Closed on
Apr 17, 2025
Sold by
Charney Jill S and Golden Mark S
Bought by
Mark Golden 2016 Ret and Golden
Current Estimated Value
Purchase Details
Closed on
Aug 28, 1991
Sold by
Weiland Robert A and Weiland Arlene B
Bought by
Charney Jill S and Golden Mark S
Create a Home Valuation Report for This Property
The Home Valuation Report is an in-depth analysis detailing your home's value as well as a comparison with similar homes in the area
Home Values in the Area
Average Home Value in this Area
Purchase History
| Date | Buyer | Sale Price | Title Company |
|---|---|---|---|
| Mark Golden 2016 Ret | -- | None Available | |
| Mark Golden 2016 Ret | -- | None Available | |
| Charney Jill S | $260,000 | -- | |
| Charney Jill S | $260,000 | -- |
Source: Public Records
Mortgage History
| Date | Status | Borrower | Loan Amount |
|---|---|---|---|
| Previous Owner | Charney Jill S | $200,000 | |
| Previous Owner | Charney Jill S | $417,000 | |
| Previous Owner | Charney Jill S | $125,000 |
Source: Public Records
Tax History Compared to Growth
Tax History
| Year | Tax Paid | Tax Assessment Tax Assessment Total Assessment is a certain percentage of the fair market value that is determined by local assessors to be the total taxable value of land and additions on the property. | Land | Improvement |
|---|---|---|---|---|
| 2025 | $12,148 | $1,239,600 | $699,700 | $539,900 |
| 2024 | $11,746 | $1,203,500 | $679,300 | $524,200 |
| 2023 | $11,205 | $1,100,700 | $550,600 | $550,100 |
| 2022 | $10,722 | $1,019,200 | $509,800 | $509,400 |
| 2021 | $10,061 | $935,000 | $467,700 | $467,300 |
| 2020 | $9,761 | $935,000 | $467,700 | $467,300 |
| 2019 | $9,131 | $873,800 | $437,100 | $436,700 |
| 2018 | $9,143 | $845,000 | $409,900 | $435,100 |
| 2017 | $8,620 | $775,200 | $376,100 | $399,100 |
| 2016 | $7,350 | $645,900 | $345,000 | $300,900 |
| 2015 | $7,008 | $603,600 | $322,400 | $281,200 |
Source: Public Records
Map
Nearby Homes
- 45 Moulton St
- 25 Columbia St
- 7 Crescent St
- 45 E Quinobequin Rd
- 2084 Washington St
- 34 Palmer Rd
- 17 Deforest Rd
- 177 Varick Rd
- 2 Longfellow Rd
- 12 Bird Hill Ave
- 10 Bird Hill Ave
- 10 Lorraine Cir
- 20 Oakland Street Front
- 8 Old Town Rd
- 33 Metacomet Rd
- 1801 Beacon St
- 6 Oakland Cir
- 6 Willow St
- 27 Oakwood Rd
- 54 Colburn Rd
- 675 Grove St Unit A
- 677 Grove St Unit B
- 677 Grove St Unit A
- 672 Grove St
- 676 Grove St
- 665 Grove St
- 666 Grove St
- 687 Grove St Unit 1
- 687 Grove St Unit G-6
- 2323 Washington St Unit 2-6
- 2323 Washington St Unit 2-5
- 2323 Washington St Unit 2-4
- 2323 Washington St Unit 2-3
- 2323 Washington St Unit 2-2
- 2323 Washington St Unit 2-1
- 2323 Washington St Unit 1-6
- 2323 Washington St Unit 1-5
- 2323 Washington St Unit 1-4
- 2323 Washington St Unit 1-3
- 2323 Washington St Unit 1-2