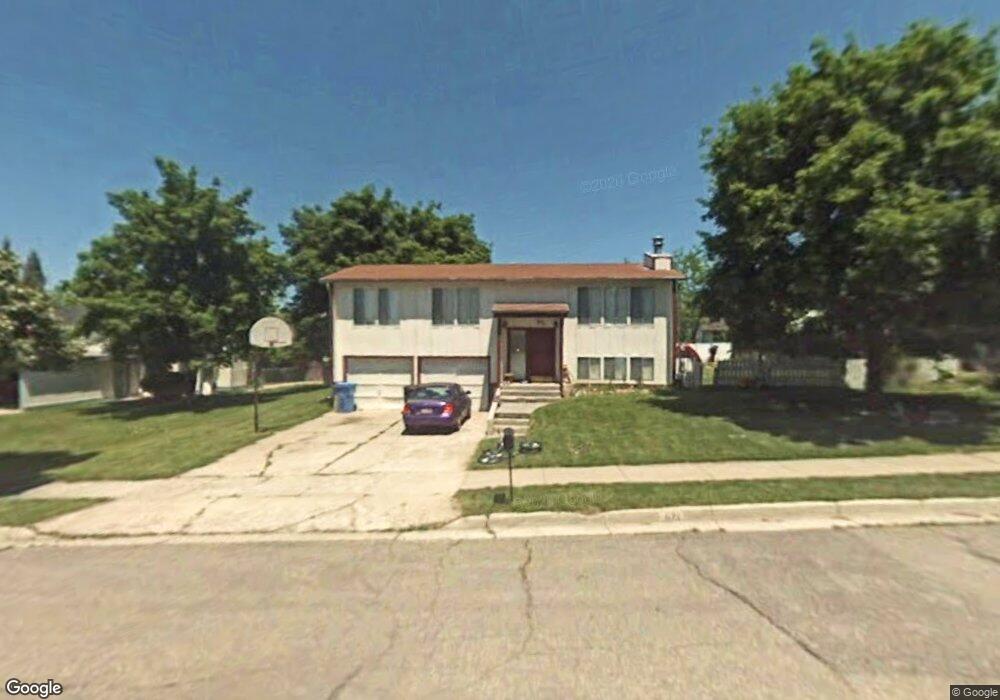
671 Maple Dr Smithfield, UT 84335
Estimated Value: $361,000 - $414,000
4
Beds
1
Bath
1,988
Sq Ft
$194/Sq Ft
Est. Value
About This Home
This home is located at 671 Maple Dr, Smithfield, UT 84335 and is currently estimated at $386,583, approximately $194 per square foot. 671 Maple Dr is a home located in Cache County with nearby schools including Birch Creek School, North Cache Middle School, and White Pine Middle School.
Ownership History
Date
Name
Owned For
Owner Type
Purchase Details
Closed on
May 12, 2021
Sold by
Jennings Lisa Maire
Bought by
Jennings Lisa Marie
Current Estimated Value
Purchase Details
Closed on
Mar 29, 2006
Sold by
Blaser Gwyllum Ricks and Blaser Beth
Bought by
Vanover Ii Charles M and Vanover Melissa S
Home Financials for this Owner
Home Financials are based on the most recent Mortgage that was taken out on this home.
Original Mortgage
$99,900
Outstanding Balance
$61,167
Interest Rate
7.62%
Mortgage Type
Adjustable Rate Mortgage/ARM
Estimated Equity
$325,416
Create a Home Valuation Report for This Property
The Home Valuation Report is an in-depth analysis detailing your home's value as well as a comparison with similar homes in the area
Home Values in the Area
Average Home Value in this Area
Purchase History
| Date | Buyer | Sale Price | Title Company |
|---|---|---|---|
| Jennings Lisa Marie | -- | Stewart Title Ins Agcy Of Ut | |
| Vanover Ii Charles M | -- | Cache Title Company |
Source: Public Records
Mortgage History
| Date | Status | Borrower | Loan Amount |
|---|---|---|---|
| Open | Vanover Ii Charles M | $99,900 | |
| Closed | Vanover Ii Charles M | $24,980 |
Source: Public Records
Tax History
| Year | Tax Paid | Tax Assessment Tax Assessment Total Assessment is a certain percentage of the fair market value that is determined by local assessors to be the total taxable value of land and additions on the property. | Land | Improvement |
|---|---|---|---|---|
| 2025 | $1,402 | $187,690 | $0 | $0 |
| 2024 | $1,501 | $188,545 | $0 | $0 |
| 2023 | $1,562 | $185,475 | $0 | $0 |
| 2022 | $1,587 | $185,480 | $0 | $0 |
| 2021 | $1,544 | $275,560 | $70,000 | $205,560 |
| 2020 | $1,449 | $241,300 | $70,000 | $171,300 |
| 2019 | $1,095 | $173,856 | $45,000 | $128,856 |
| 2018 | $1,004 | $154,200 | $45,000 | $109,200 |
| 2017 | $935 | $78,375 | $0 | $0 |
| 2016 | $951 | $78,375 | $0 | $0 |
| 2015 | $955 | $78,375 | $0 | $0 |
| 2014 | $795 | $66,575 | $0 | $0 |
| 2013 | $761 | $66,575 | $0 | $0 |
Source: Public Records
Map
Nearby Homes
Your Personal Tour Guide
Ask me questions while you tour the home.