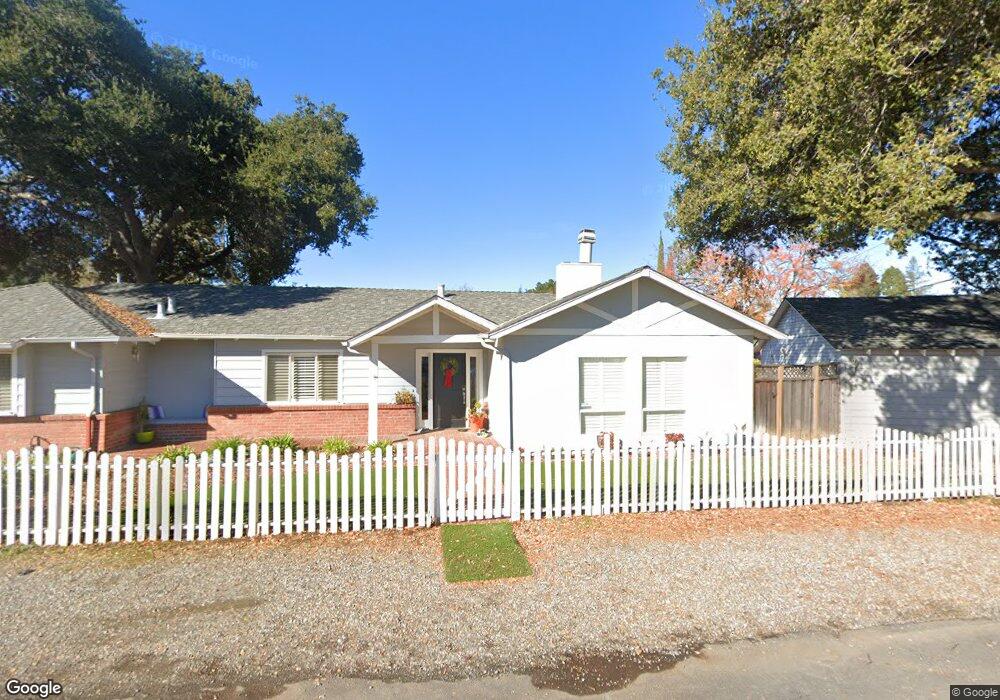
671 Palm Ave Los Altos, CA 94022
Estimated Value: $3,487,000 - $4,450,732
2
Beds
2
Baths
1,227
Sq Ft
$3,115/Sq Ft
Est. Value
About This Home
This home is located at 671 Palm Ave, Los Altos, CA 94022 and is currently estimated at $3,822,433, approximately $3,115 per square foot. 671 Palm Ave is a home located in Santa Clara County with nearby schools including Gardner Bullis Elementary School, Ardis G. Egan Junior High School, and Los Altos High School.
Ownership History
Date
Name
Owned For
Owner Type
Purchase Details
Closed on
Sep 20, 2007
Sold by
Critchfield Joe P and Critchfield Nancy A
Bought by
671 Palm Avenue Llc
Current Estimated Value
Purchase Details
Closed on
Aug 15, 2000
Sold by
Favor Lynn A and Hertzfeld Bruce
Bought by
Critchfield Investment Partners Lp
Purchase Details
Closed on
Jul 31, 1998
Sold by
Armando Lisa B
Bought by
Favor Lynn A and Hertzfeld Bruce
Home Financials for this Owner
Home Financials are based on the most recent Mortgage that was taken out on this home.
Original Mortgage
$556,000
Interest Rate
7%
Purchase Details
Closed on
May 19, 1996
Sold by
Armando Vincent
Bought by
Armando Lisa B
Home Financials for this Owner
Home Financials are based on the most recent Mortgage that was taken out on this home.
Original Mortgage
$336,000
Interest Rate
7.97%
Create a Home Valuation Report for This Property
The Home Valuation Report is an in-depth analysis detailing your home's value as well as a comparison with similar homes in the area
Home Values in the Area
Average Home Value in this Area
Purchase History
| Date | Buyer | Sale Price | Title Company |
|---|---|---|---|
| 671 Palm Avenue Llc | -- | None Available | |
| Critchfield Investment Partners Lp | $950,000 | Chicago Title Co | |
| Favor Lynn A | $695,000 | Old Republic Title Company | |
| Armando Lisa B | -- | Old Republic Title Company | |
| Armando Lisa B | $420,000 | Old Republic Title Company |
Source: Public Records
Mortgage History
| Date | Status | Borrower | Loan Amount |
|---|---|---|---|
| Previous Owner | Favor Lynn A | $556,000 | |
| Previous Owner | Armando Lisa B | $336,000 |
Source: Public Records
Tax History Compared to Growth
Tax History
| Year | Tax Paid | Tax Assessment Tax Assessment Total Assessment is a certain percentage of the fair market value that is determined by local assessors to be the total taxable value of land and additions on the property. | Land | Improvement |
|---|---|---|---|---|
| 2025 | $17,571 | $1,434,847 | $1,205,474 | $229,373 |
| 2024 | $17,571 | $1,406,714 | $1,181,838 | $224,876 |
| 2023 | $17,307 | $1,379,132 | $1,158,665 | $220,467 |
| 2022 | $17,164 | $1,352,092 | $1,135,947 | $216,145 |
| 2021 | $17,287 | $1,325,581 | $1,113,674 | $211,907 |
| 2020 | $17,340 | $1,311,990 | $1,102,255 | $209,735 |
| 2019 | $16,580 | $1,286,266 | $1,080,643 | $205,623 |
| 2018 | $16,247 | $1,261,046 | $1,059,454 | $201,592 |
| 2017 | $15,945 | $1,236,321 | $1,038,681 | $197,640 |
| 2016 | $15,693 | $1,212,080 | $1,018,315 | $193,765 |
| 2015 | $15,369 | $1,193,874 | $1,003,019 | $190,855 |
| 2014 | $15,382 | $1,170,489 | $983,372 | $187,117 |
Source: Public Records
Map
Nearby Homes
- 179 Giffin Rd
- 599 University Ave
- 477 Lassen St Unit 9
- 477 Lassen St Unit 6
- 484 Gabilan St Unit 3
- 450 1st St Unit 204
- 450 1st St Unit 107
- 450 1st St Unit 201
- 72 Bay Tree Ln
- 425 1st St Unit 23
- 425 1st St Unit 31
- 425 1st St Unit 21
- 389 1st St Unit 14
- 389 1st St Unit 31
- 23 Bay Tree Ln
- 893 Madonna Way
- 4 Bay Tree Ln
- 24570 Ruth Lee Ct
- 12797 Normandy Ln
- 12690 Dianne Dr