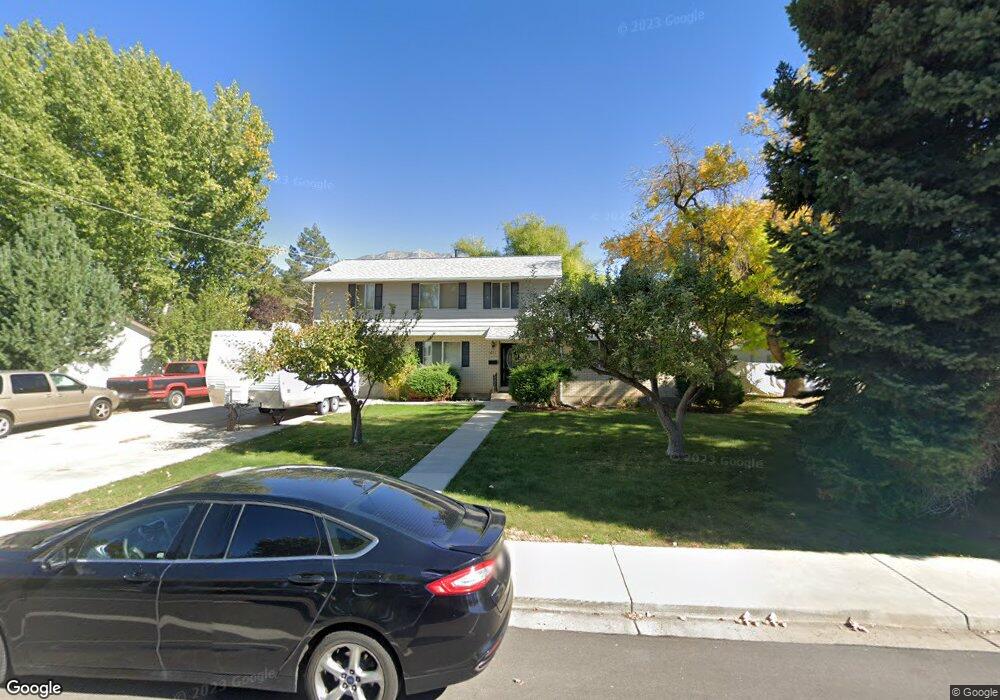
671 S Main St Orem, UT 84058
Orem South NeighborhoodEstimated Value: $323,058 - $494,000
1
Bed
2
Baths
585
Sq Ft
$687/Sq Ft
Est. Value
About This Home
This home is located at 671 S Main St, Orem, UT 84058 and is currently estimated at $401,686, approximately $686 per square foot. 671 S Main St is a home located in Utah County with nearby schools including Westmore Elementary School, Lakeridge Jr High School, and Mountain View High School.
Ownership History
Date
Name
Owned For
Owner Type
Purchase Details
Closed on
Dec 31, 2024
Sold by
Delange Family Trust and Delange Clark D
Bought by
Delange Jeffrey
Current Estimated Value
Home Financials for this Owner
Home Financials are based on the most recent Mortgage that was taken out on this home.
Original Mortgage
$200,000
Outstanding Balance
$198,049
Interest Rate
5%
Mortgage Type
Seller Take Back
Estimated Equity
$203,637
Purchase Details
Closed on
Jun 21, 2018
Sold by
Dclange Clark D and Dclange Nola Veloy
Bought by
Delange Clark D and Delange Nola C
Create a Home Valuation Report for This Property
The Home Valuation Report is an in-depth analysis detailing your home's value as well as a comparison with similar homes in the area
Home Values in the Area
Average Home Value in this Area
Purchase History
| Date | Buyer | Sale Price | Title Company |
|---|---|---|---|
| Delange Jeffrey | -- | None Listed On Document | |
| Delange Clark D | -- | None Available |
Source: Public Records
Mortgage History
| Date | Status | Borrower | Loan Amount |
|---|---|---|---|
| Open | Delange Jeffrey | $200,000 |
Source: Public Records
Tax History
| Year | Tax Paid | Tax Assessment Tax Assessment Total Assessment is a certain percentage of the fair market value that is determined by local assessors to be the total taxable value of land and additions on the property. | Land | Improvement |
|---|---|---|---|---|
| 2025 | $1,265 | $168,245 | -- | -- |
| 2024 | $1,159 | $154,660 | $0 | $0 |
| 2023 | $1,159 | $152,350 | $0 | $0 |
| 2022 | $1,226 | $156,145 | $0 | $0 |
| 2021 | $1,136 | $219,000 | $178,100 | $40,900 |
| 2020 | $963 | $182,600 | $142,500 | $40,100 |
| 2019 | $871 | $171,600 | $131,500 | $40,100 |
| 2018 | $794 | $149,600 | $113,200 | $36,400 |
| 2017 | $716 | $72,270 | $0 | $0 |
| 2016 | $658 | $61,215 | $0 | $0 |
| 2015 | $696 | $61,215 | $0 | $0 |
| 2014 | $680 | $59,565 | $0 | $0 |
Source: Public Records
Map
Nearby Homes
Your Personal Tour Guide
Ask me questions while you tour the home.