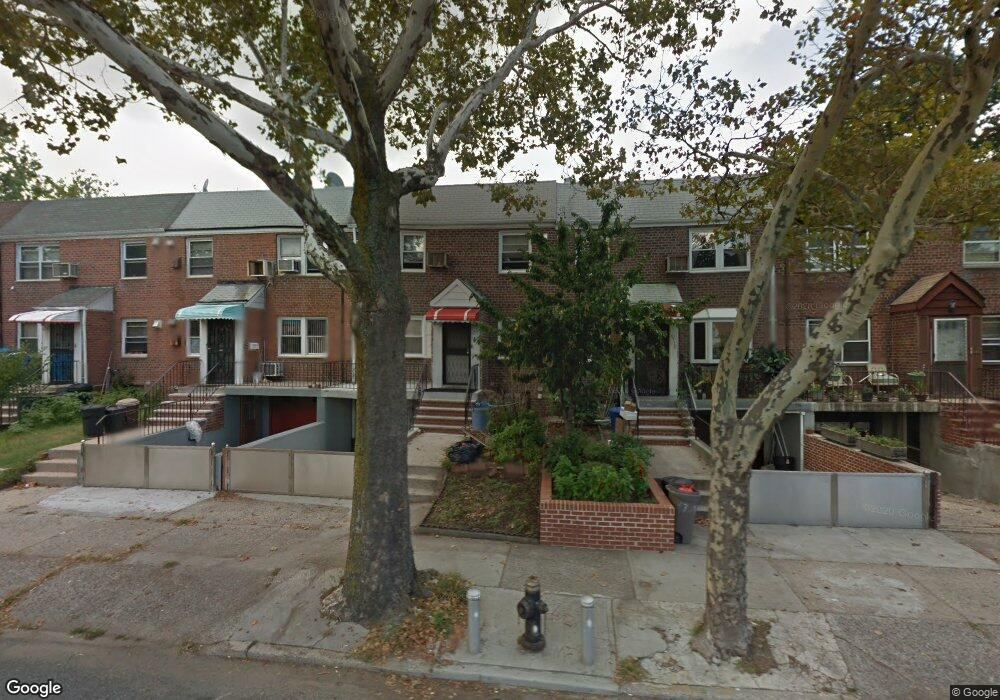
6712 Utopia Pkwy Fresh Meadows, NY 11365
Fresh Meadows NeighborhoodEstimated Value: $1,085,000 - $1,847,795
--
Bed
--
Bath
2,656
Sq Ft
$551/Sq Ft
Est. Value
About This Home
This home is located at 6712 Utopia Pkwy, Fresh Meadows, NY 11365 and is currently estimated at $1,462,949, approximately $550 per square foot. 6712 Utopia Pkwy is a home located in Queens County with nearby schools including P.S. 173 - Fresh Meadow, George J. Ryan Middle School 216, and Francis Lewis High School.
Ownership History
Date
Name
Owned For
Owner Type
Purchase Details
Closed on
Jun 2, 2017
Sold by
Fung Priscilla Ying Ngai
Bought by
Priscilla Ying Ngai Fung As Trustee and Priscilla Ying Ngai Fung Living Trust
Current Estimated Value
Purchase Details
Closed on
Jul 24, 2015
Sold by
Moy Tat Ying and Moy Wai Ying
Bought by
Fung Priscilla Ying Ngai and Wong Ying Lan
Purchase Details
Closed on
Feb 2, 1999
Sold by
Slawotsky Joel and Slawotsky Julie
Bought by
Moy Tat Ying and Moy Wai Ying
Home Financials for this Owner
Home Financials are based on the most recent Mortgage that was taken out on this home.
Original Mortgage
$237,600
Interest Rate
6.78%
Purchase Details
Closed on
May 23, 1996
Sold by
Bitterman Martin and Bitterman Constance
Bought by
Slawotsky Joel and Slawotsky Julie L
Home Financials for this Owner
Home Financials are based on the most recent Mortgage that was taken out on this home.
Original Mortgage
$220,500
Interest Rate
8.4%
Create a Home Valuation Report for This Property
The Home Valuation Report is an in-depth analysis detailing your home's value as well as a comparison with similar homes in the area
Home Values in the Area
Average Home Value in this Area
Purchase History
| Date | Buyer | Sale Price | Title Company |
|---|---|---|---|
| Priscilla Ying Ngai Fung As Trustee | -- | -- | |
| Fung Priscilla Ying Ngai | $926,000 | -- | |
| Moy Tat Ying | $297,000 | Chicago Title Insurance Co | |
| Slawotsky Joel | $245,000 | -- |
Source: Public Records
Mortgage History
| Date | Status | Borrower | Loan Amount |
|---|---|---|---|
| Previous Owner | Moy Tat Ying | $237,600 | |
| Previous Owner | Slawotsky Joel | $220,500 |
Source: Public Records
Tax History Compared to Growth
Tax History
| Year | Tax Paid | Tax Assessment Tax Assessment Total Assessment is a certain percentage of the fair market value that is determined by local assessors to be the total taxable value of land and additions on the property. | Land | Improvement |
|---|---|---|---|---|
| 2025 | $9,755 | $51,482 | $13,309 | $38,173 |
| 2024 | $9,755 | $48,569 | $11,791 | $36,778 |
| 2023 | $9,755 | $48,569 | $9,983 | $38,586 |
| 2022 | $9,577 | $83,760 | $19,140 | $64,620 |
| 2021 | $9,570 | $69,420 | $19,140 | $50,280 |
| 2020 | $9,081 | $70,560 | $19,140 | $51,420 |
| 2019 | $8,467 | $65,040 | $19,140 | $45,900 |
| 2018 | $8,251 | $40,474 | $12,203 | $28,271 |
| 2017 | $8,150 | $39,978 | $13,639 | $26,339 |
| 2016 | $7,576 | $39,978 | $13,639 | $26,339 |
| 2015 | $4,329 | $35,752 | $16,045 | $19,707 |
| 2014 | $4,329 | $33,729 | $16,746 | $16,983 |
Source: Public Records
Map
Nearby Homes
- 67-07 Fresh Meadow Ln
- 17508 65th Ave
- 6737 180th St
- 6740 182nd St
- 18108 69th Ave
- 64-04 Utopia Pkwy
- 61-40 173rd St
- 182-14 69th Ave
- 65-15 183rd St
- 6967 181st St
- 183-19 69th Ave
- 61-31 182nd St
- 183-11 64th Ave
- 6532 170th St
- 70-07 171st St
- 17211 Horace Harding Expy
- 7318 180th St
- 71-27 172nd St
- 6547 167th St
- 65-47 167th St
- 6710 Utopia Pkwy
- 6714 Utopia Pkwy
- 6708 Utopia Pkwy
- 6718 Utopia Pkwy
- 6720 Utopia Pkwy Unit 2 Fl
- 6720 Utopia Pkwy Unit 1Fl
- 6720 Utopia Pkwy Unit 1&2 Fl
- 6720 Utopia Pkwy
- 6704 Utopia Pkwy
- 6720 Utopia Pkwy
- 17508 67th Ave
- 67-02 Utopia Pkwy Unit 2Fl
- 67-22 Utopia Pkwy
- 6722 Utopia Pkwy
- 6702 Utopia Pkwy Unit 2Fl
- 6702 Utopia Pkwy
- 6702 Utopia Pkwy Unit 2Fl
- 17506 67th Ave
- 17508 67th Ave
- 6724 Utopia Pkwy