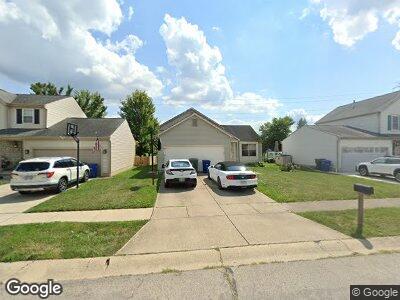
6713 Fallon Ln Canal Winchester, OH 43110
East Columbus-White Ash NeighborhoodEstimated Value: $256,000 - $286,000
3
Beds
2
Baths
1,500
Sq Ft
$184/Sq Ft
Est. Value
About This Home
This home is located at 6713 Fallon Ln, Canal Winchester, OH 43110 and is currently estimated at $275,306, approximately $183 per square foot. 6713 Fallon Ln is a home located in Franklin County with nearby schools including Winchester Trail Elementary School, Indian Trail Elementary School, and Canal Winchester Middle School.
Ownership History
Date
Name
Owned For
Owner Type
Purchase Details
Closed on
Oct 19, 2001
Sold by
Hobbs Michael E and Hobbs Melissa C
Bought by
Hathaway Steve R
Current Estimated Value
Home Financials for this Owner
Home Financials are based on the most recent Mortgage that was taken out on this home.
Original Mortgage
$120,051
Interest Rate
6.92%
Mortgage Type
FHA
Purchase Details
Closed on
Jun 24, 1996
Sold by
Trinity Home Builders In
Bought by
Hobbs Michael E and Hobbs Melissa C
Home Financials for this Owner
Home Financials are based on the most recent Mortgage that was taken out on this home.
Original Mortgage
$107,150
Interest Rate
8.29%
Mortgage Type
FHA
Purchase Details
Closed on
May 21, 1996
Sold by
Homewod Corp
Bought by
Trinity Home Builders Inc
Home Financials for this Owner
Home Financials are based on the most recent Mortgage that was taken out on this home.
Original Mortgage
$107,150
Interest Rate
8.29%
Mortgage Type
FHA
Create a Home Valuation Report for This Property
The Home Valuation Report is an in-depth analysis detailing your home's value as well as a comparison with similar homes in the area
Home Values in the Area
Average Home Value in this Area
Purchase History
| Date | Buyer | Sale Price | Title Company |
|---|---|---|---|
| Hathaway Steve R | $121,000 | -- | |
| Hobbs Michael E | $107,203 | -- | |
| Trinity Home Builders Inc | $80,000 | -- |
Source: Public Records
Mortgage History
| Date | Status | Borrower | Loan Amount |
|---|---|---|---|
| Open | Hathaway Steven R | $108,880 | |
| Closed | Hathaway Steve R | $35,300 | |
| Closed | Hathaway Steve R | $125,500 | |
| Closed | Hathaway Steve R | $120,051 | |
| Previous Owner | Hobbs Michael E | $107,150 |
Source: Public Records
Tax History Compared to Growth
Tax History
| Year | Tax Paid | Tax Assessment Tax Assessment Total Assessment is a certain percentage of the fair market value that is determined by local assessors to be the total taxable value of land and additions on the property. | Land | Improvement |
|---|---|---|---|---|
| 2024 | $3,494 | $72,350 | $23,280 | $49,070 |
| 2023 | $3,473 | $72,345 | $23,275 | $49,070 |
| 2022 | $2,722 | $49,950 | $13,020 | $36,930 |
| 2021 | $2,753 | $49,950 | $13,020 | $36,930 |
| 2020 | $2,743 | $49,950 | $13,020 | $36,930 |
| 2019 | $2,601 | $40,640 | $10,400 | $30,240 |
| 2018 | $2,539 | $40,640 | $10,400 | $30,240 |
| 2017 | $2,544 | $40,640 | $10,400 | $30,240 |
| 2016 | $2,533 | $37,800 | $7,840 | $29,960 |
| 2015 | $2,542 | $37,800 | $7,840 | $29,960 |
| 2014 | $2,541 | $37,800 | $7,840 | $29,960 |
| 2013 | $1,327 | $39,795 | $8,260 | $31,535 |
Source: Public Records
Map
Nearby Homes
- 6802 Kristins Cove Ln
- 6786 Warriner Way
- 5694 Danmar Dr
- 5682 Levi Kramer Blvd
- 5846 Canal Bridge Dr
- 5443 John Browning Ct
- 7011 Selva Trail Dr
- 630 W Waterloo St
- 6963 Weurful Dr
- 5680 Winchester Pike
- 5536 Winchester Meadows Dr
- 5569 Harvest Curve Ln
- 6999 Winchester Crossing Blvd
- 6983 Remsen Dr Unit 77A
- 5210 Novelty Ave Unit 73D
- 5176 Lodi Dr Unit 26B
- 6682 Lagrange Dr Unit 48B
- 6709 Axtel Dr Unit 5A
- 5504 Rothermund Dr
- 5332 Wadley Ct
- 6713 Fallon Ln
- 6705 Fallon Ln
- 6721 Fallon Ln
- 6729 Fallon Ln
- 6697 Fallon Ln
- 6737 Fallon Ln
- 6689 Fallon Ln
- 6712 Fallon Ln
- 6720 Fallon Ln
- 6704 Fallon Ln
- 6745 Fallon Ln
- 6696 Fallon Ln
- 6728 Fallon Ln
- 6688 Fallon Ln
- 6736 Fallon Ln
- 6753 Fallon Ln
- 6673 Fallon Ln
- 6744 Fallon Ln
- 6680 Fallon Ln
- 6705 Jennyann Way