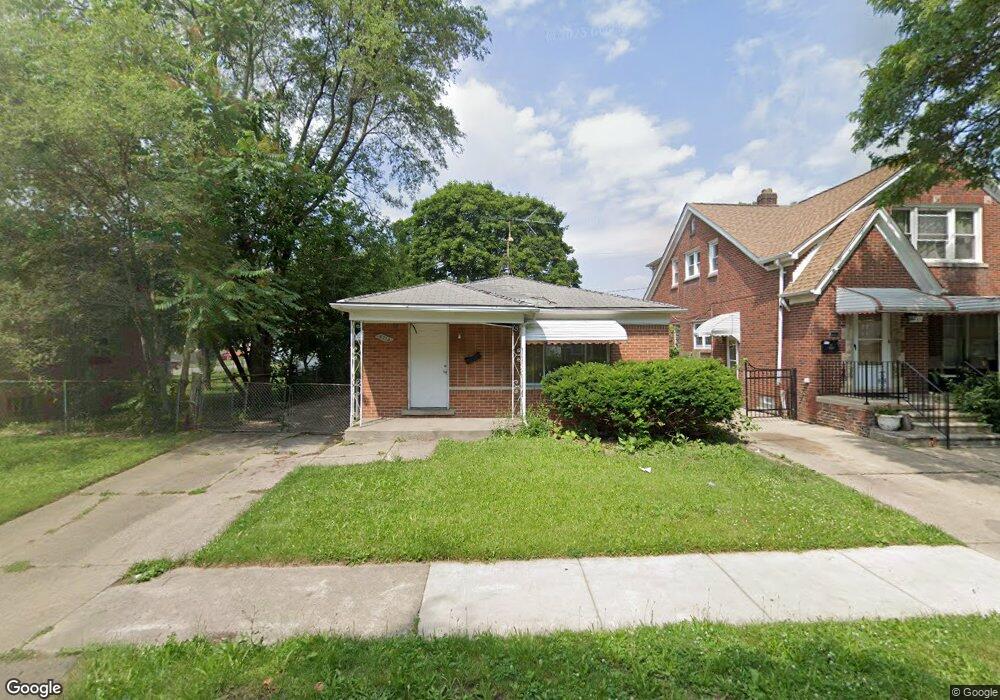
6715 Brace St Detroit, MI 48228
Warrendale NeighborhoodEstimated Value: $63,000 - $132,000
--
Bed
1
Bath
960
Sq Ft
$102/Sq Ft
Est. Value
About This Home
This home is located at 6715 Brace St, Detroit, MI 48228 and is currently estimated at $98,125, approximately $102 per square foot. 6715 Brace St is a home located in Wayne County with nearby schools including Carver STEM Academy, Charles L. Spain Elementary-Middle School, and Edward 'Duke' Ellington Conservatory of Music and Art.
Ownership History
Date
Name
Owned For
Owner Type
Purchase Details
Closed on
Jun 9, 2025
Sold by
Boyer Kenneth
Bought by
Dabney Kennocha K and Boyer Kenneth
Current Estimated Value
Purchase Details
Closed on
Oct 15, 2016
Sold by
Spencer Investments Group
Bought by
Boyer Kenneth
Purchase Details
Closed on
Nov 11, 2014
Sold by
Treasurer Of The Charter County Of Wayne
Bought by
Spencer Investment Group Llc
Purchase Details
Closed on
Nov 29, 2010
Sold by
Wojtowicz Raymond J
Bought by
Boyer Kenneth O
Purchase Details
Closed on
Feb 23, 2006
Sold by
Fannie Mae
Bought by
Lakkis Amani
Purchase Details
Closed on
Nov 17, 2004
Sold by
Slim Moussa
Bought by
Mortgage Electronic Registration Systems and Rbc Mortgage Co
Purchase Details
Closed on
Jul 31, 2002
Sold by
Lund Dennis
Bought by
Slim Moussa
Create a Home Valuation Report for This Property
The Home Valuation Report is an in-depth analysis detailing your home's value as well as a comparison with similar homes in the area
Home Values in the Area
Average Home Value in this Area
Purchase History
| Date | Buyer | Sale Price | Title Company |
|---|---|---|---|
| Dabney Kennocha K | -- | None Listed On Document | |
| Dabney Kennocha K | -- | None Listed On Document | |
| Boyer Kenneth | -- | None Available | |
| Spencer Investment Group Llc | $4,800 | None Available | |
| Boyer Kenneth O | $4,015 | None Available | |
| Lakkis Amani | $57,000 | Greco | |
| Mortgage Electronic Registration Systems | $84,594 | -- | |
| Slim Moussa | $85,000 | -- |
Source: Public Records
Mortgage History
| Date | Status | Borrower | Loan Amount |
|---|---|---|---|
| Closed | Slim Moussa | -- |
Source: Public Records
Tax History Compared to Growth
Tax History
| Year | Tax Paid | Tax Assessment Tax Assessment Total Assessment is a certain percentage of the fair market value that is determined by local assessors to be the total taxable value of land and additions on the property. | Land | Improvement |
|---|---|---|---|---|
| 2025 | $1,111 | $31,700 | $0 | $0 |
| 2024 | $1,111 | $26,600 | $0 | $0 |
| 2023 | $1,077 | $20,800 | $0 | $0 |
| 2022 | $1,176 | $20,400 | $0 | $0 |
| 2021 | $251 | $0 | $0 | $0 |
| 2020 | $1,136 | $14,300 | $0 | $0 |
| 2019 | $1,119 | $12,500 | $0 | $0 |
| 2018 | $975 | $12,500 | $0 | $0 |
| 2017 | $243 | $12,800 | $0 | $0 |
| 2016 | $1,575 | $15,800 | $0 | $0 |
| 2015 | $1,580 | $15,800 | $0 | $0 |
| 2013 | $2,365 | $23,651 | $0 | $0 |
| 2010 | -- | $34,675 | $947 | $33,728 |
Source: Public Records
Map
Nearby Homes
- 6722 Stahelin Ave
- 6712 Artesian St
- 6744 Artesian St
- 6760 Warwick St
- 6426 Artesian St
- 6403 Faust Ave
- 6360 Brace St
- 6354 Stahelin Ave
- 6346 Stahelin Ave
- 6508 Penrod St
- 6338 Stahelin Ave
- 6390 Faust Ave
- 6387 Warwick St
- 6720 Rosemont Ave
- 6851 Piedmont St
- 6339 Warwick St
- 7254 Faust Ave
- 7230 Penrod St
- 6746 Westwood St
- 6380 Rosemont Ave
- 6721 Brace St
- 6701 Brace St
- 6731 Brace St
- 6739 Brace St
- 6714 Stahelin Ave
- 6700 Stahelin Ave
- 6545 Brace St
- 6747 Brace St
- 6730 Stahelin Ave
- 6730 Stahelin Ave
- 6722 Brace St
- 6738 Stahelin Ave
- 6700 Brace St
- 6730 Brace St
- 6539 Brace St
- 6755 Brace St
- 6714 Brace St
- 6546 Stahelin Ave
- 6744 Stahelin Ave
- 6738 Brace St