6715 Edsall Rd Springfield, VA 22151
Estimated Value: $626,000 - $706,000
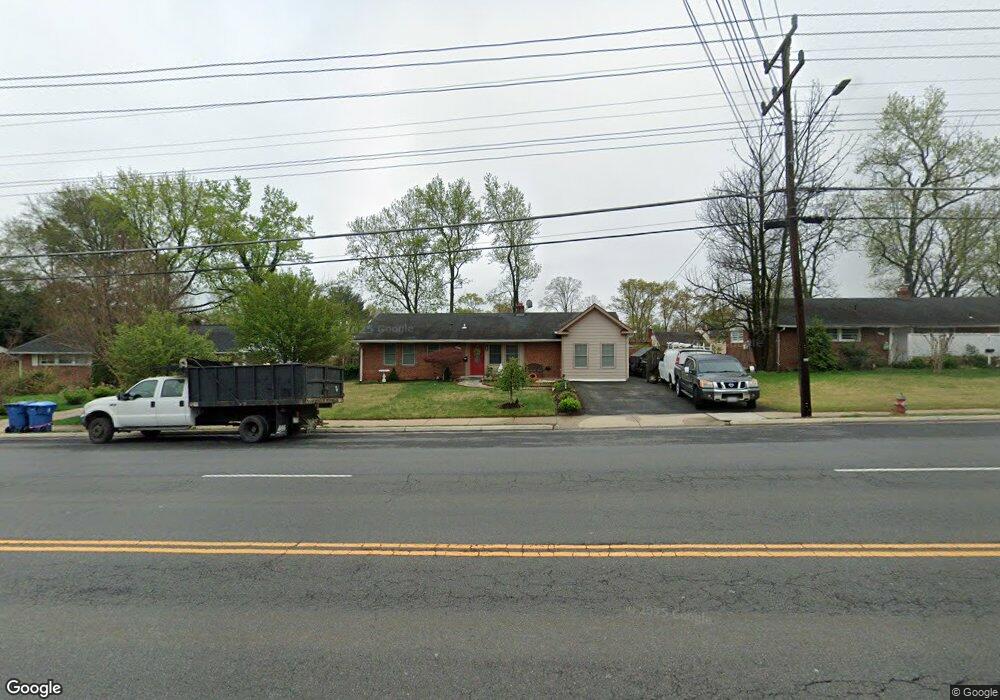
About This Home
This home is located at 6715 Edsall Rd, Springfield, VA 22151 and is currently estimated at $666,497, approximately $340 per square foot. 6715 Edsall Rd is a home located in Fairfax County with nearby schools including Bren Mar Park Elementary School, Holmes Middle School, and Edison High School.
Ownership History
We collect this data history from publicly available records. To have your information removed, we recommend requesting removal directly through your county’s website.
Purchase Details
Home Financials for this Owner
Home Financials are based on the most recent Mortgage that was taken out on this home.Purchase Details
Purchase Details
Home Financials for this Owner
Home Financials are based on the most recent Mortgage that was taken out on this home.Home Values in the Area
Average Home Value in this Area
Purchase History
We collect this data history from publicly available records. To have your information removed, we recommend requesting removal directly through your county’s website.
| Date | Buyer | Sale Price | Title Company |
|---|---|---|---|
| -- | None Available | ||
| -- | Penfed Title Llc | ||
| $325,000 | -- |
Mortgage History
We collect this data history from publicly available records. To have your information removed, we recommend requesting removal directly through your county’s website.
| Date | Status | Borrower | Loan Amount |
|---|---|---|---|
| Open | $407,000 | ||
| Previous Owner | $322,414 |
Tax History
We collect this data history from publicly available records. To have your information removed, we recommend requesting removal directly through your county’s website.
| Year | Tax Paid | Tax Assessment Tax Assessment Total Assessment is a certain percentage of the fair market value that is determined by local assessors to be the total taxable value of land and additions on the property. | Land | Improvement |
|---|---|---|---|---|
| 2025 | $6,306 | $596,960 | $300,000 | $296,960 |
| 2024 | $6,306 | $544,310 | $276,000 | $268,310 |
| 2023 | $6,732 | $596,580 | $266,000 | $330,580 |
| 2022 | $6,215 | $543,530 | $243,000 | $300,530 |
| 2021 | $5,417 | $461,600 | $224,000 | $237,600 |
| 2020 | $5,296 | $447,460 | $219,000 | $228,460 |
| 2019 | $5,077 | $428,980 | $205,000 | $223,980 |
| 2018 | $4,571 | $397,490 | $192,000 | $205,490 |
| 2017 | $4,615 | $397,490 | $192,000 | $205,490 |
| 2016 | $4,431 | $382,460 | $181,000 | $201,460 |
| 2015 | $4,141 | $371,060 | $181,000 | $190,060 |
| 2014 | $3,462 | $310,900 | $171,000 | $139,900 |
Map
- 6714 Edsall Rd
- 6705 New Hope Dr
- 5408 Dublin Ave
- 5213 Montgomery St
- 5012 Birch Ln
- 5278 Bradgen Ct
- 5533 Belfast Place
- 7108 Larrlyn Dr
- 6480 Cheyenne Dr Unit 304
- 6480 Cheyenne Dr Unit 203
- 6495 Tayack Place Unit 204
- 6476 Cheyenne Dr Unit 301
- 6481 Cheyenne Dr Unit 304
- 6475 Cheyenne Dr Unit 301
- 6577 Braddock
- 6579 Braddock Rd
- 7200 Vellex Ln
- 6623 Locust Way
- 4913 Grafton St
- 4709 Randolph Ct
- 6717 Edsall Rd
- 6713 Edsall Rd
- 6714 New Hope Dr
- 6712 New Hope Dr
- 6716 New Hope Dr
- 6719 Edsall Rd
- 6711 Edsall Rd
- 6710 New Hope Dr
- 6718 New Hope Dr
- 5230 Cather Rd
- 6716 Edsall Rd
- 6721 Edsall Rd
- 6709 Edsall Rd
- 6708 New Hope Dr
- 6720 New Hope Dr
- 6718 Edsall Rd
- 6708 Edsall Rd
- 6713 New Hope Dr
- 6711 New Hope Dr
- 6723 Edsall Rd
Ask me questions while you tour the home.