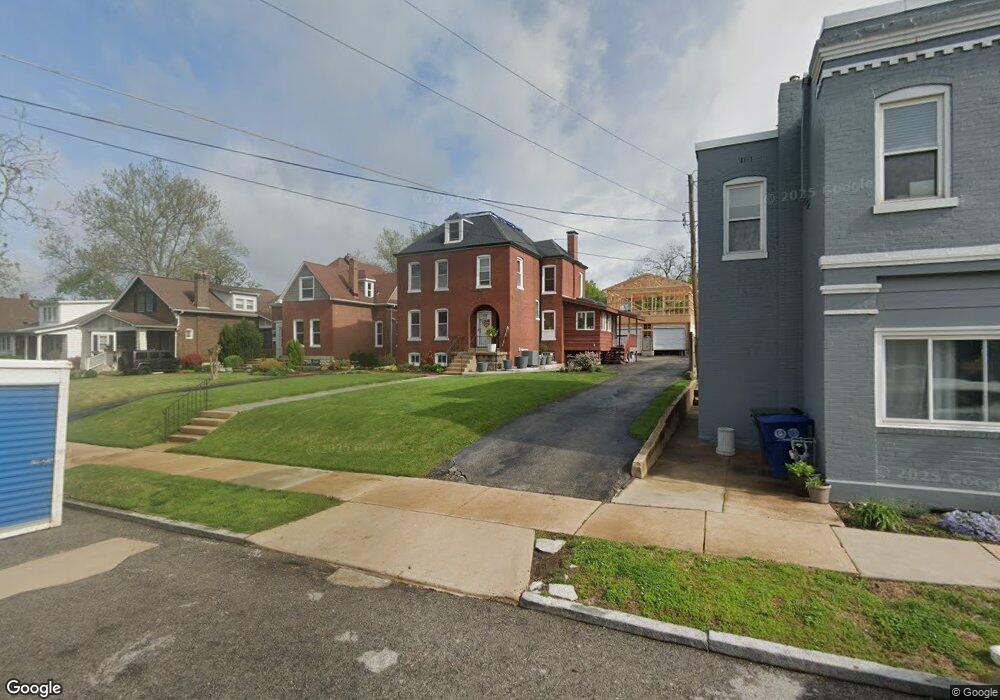
6715 Scanlan Ave Saint Louis, MO 63139
Lindenwood Park NeighborhoodEstimated Value: $256,804 - $360,000
About This Home
This home is located at 6715 Scanlan Ave, Saint Louis, MO 63139 and is currently estimated at $296,701, approximately $157 per square foot. 6715 Scanlan Ave is a home located in St. Louis City with nearby schools including Mason Elementary School, Long International Middle School, and Roosevelt High School.
Ownership History
We collect this data history from publicly available records. To have your information removed, we recommend requesting removal directly through your county’s website.
Purchase Details
Home Financials for this Owner
Home Financials are based on the most recent Mortgage that was taken out on this home.Purchase Details
Home Financials for this Owner
Home Financials are based on the most recent Mortgage that was taken out on this home.Purchase Details
Home Values in the Area
Average Home Value in this Area
Purchase History
We collect this data history from publicly available records. To have your information removed, we recommend requesting removal directly through your county’s website.
| Date | Buyer | Sale Price | Title Company |
|---|---|---|---|
| -- | None Available | ||
| -- | -- | ||
| -- | -- |
Mortgage History
We collect this data history from publicly available records. To have your information removed, we recommend requesting removal directly through your county’s website.
| Date | Status | Borrower | Loan Amount |
|---|---|---|---|
| Open | $220,924 | ||
| Previous Owner | $49,000 |
Tax History
We collect this data history from publicly available records. To have your information removed, we recommend requesting removal directly through your county’s website.
| Year | Tax Paid | Tax Assessment Tax Assessment Total Assessment is a certain percentage of the fair market value that is determined by local assessors to be the total taxable value of land and additions on the property. | Land | Improvement |
|---|---|---|---|---|
| 2025 | $2,489 | $34,430 | $4,240 | $30,190 |
| 2024 | $2,368 | $29,400 | $4,240 | $25,160 |
| 2023 | $2,368 | $29,400 | $4,240 | $25,160 |
| 2022 | $2,304 | $27,540 | $4,240 | $23,300 |
| 2021 | $2,301 | $27,540 | $4,240 | $23,300 |
| 2020 | $2,158 | $26,010 | $4,240 | $21,770 |
| 2019 | $2,151 | $26,010 | $4,240 | $21,770 |
| 2018 | $1,882 | $22,020 | $3,760 | $18,260 |
| 2017 | $1,850 | $22,020 | $3,760 | $18,260 |
| 2016 | $1,645 | $19,290 | $3,760 | $15,520 |
| 2015 | $1,492 | $19,280 | $3,760 | $15,520 |
| 2014 | $1,397 | $19,280 | $3,760 | $15,520 |
| 2013 | -- | $18,050 | $3,760 | $14,290 |
Map
- 3205 Ivanhoe Ave
- 6591 Scanlan Ave
- 3123 Ivanhoe Ave
- 6837 Bradley Ave
- 6635 Fyler Ave
- 3308 Jamieson Ave
- 3166 Tamm Ave
- 6523 Odell St
- 6559 Marmaduke Ave
- 6969 Marquette Ave
- 6718 Oleatha Ave
- 6540 Mccune Ave
- 6223 Wyoming St
- 6231 Fyler Ave
- 6300 Fyler Ave
- 6609 Pernod Ave
- 3508 Watson Rd
- 6228 Fyler Ave
- 6569 Pernod Ave
- 3203 Byron Place
- 3207 Ivanhoe Ave Unit A(2F)
- 3207 Ivanhoe Ave Unit 1F
- 3207 Ivanhoe Ave Unit A
- 3215 Ivanhoe Ave
- 6714 Scanlan Ave
- 3217 Ivanhoe Ave
- 6594 Scanlan Ave
- 6711 Scanlan Ave
- 6724 Scanlan Ave
- 6590 Scanlan Ave
- 6590 Scanlan Ave
- 3225 Ivanhoe Ave
- 6728 Scanlan Ave
- 3220 Ivanhoe Ave
- 3231 Ivanhoe Ave
- 6586 Scanlan Ave
- 3175 Ivanhoe Ave
- 3224 Ivanhoe Ave
- 6595 Scanlan Ave
- 6730 Scanlan Ave
Ask me questions while you tour the home.