B
Landlord's Agent in 2025
Bryan Lewright
TexCen Realty
(512) 240-2649
2 Total Sales
Estimated Value: $337,903 - $412,000
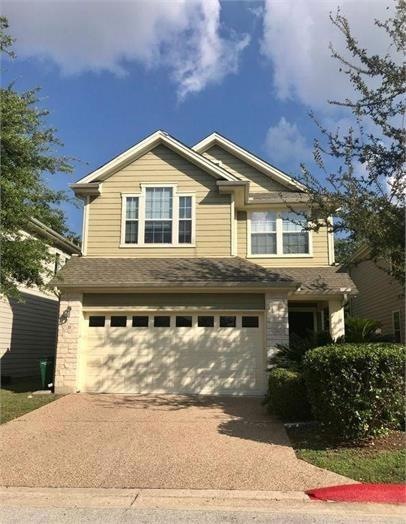
Newer style home with lots of upgrades. Gorgeous granite counters, 42 inch kitchen cabinets, hardwood flooring in main living areas, double pane E-glass windows, security system, recently purchased and lightly used washer and dryer, covered front and rear porch, in ground sprinkler system, backs to wooded lot, gated community. Close to shopping and schools in the heart of South Austin. Cable and Fiber internet options available. You will want to see this one!! Tenant responsible for $20/mo Utility & Maintenance Reduction Program (see app. guidelines) - this is a monthly air filter drop off program.
Last Agent to Rent the Property
TexCen Realty Brokerage Phone: (512) 292-0800 License #0705555 Listed on: 01/07/2025
| Date | Buyer | Sale Price | Title Company |
|---|---|---|---|
| Machado Sebastian | -- | None Available |
| Date | Status | Borrower | Loan Amount |
|---|---|---|---|
| Open | Machado Sebastian | $213,069 |
| Date | Event | Price | List to Sale | Price per Sq Ft | Prior Sale |
|---|---|---|---|---|---|
| 01/25/2025 01/25/25 | Rented | $2,275 | 0.0% | -- | |
| 01/10/2025 01/10/25 | Under Contract | -- | -- | -- | |
| 01/07/2025 01/07/25 | For Rent | $2,275 | +1.3% | -- | |
| 09/15/2023 09/15/23 | Rented | $2,245 | 0.0% | -- | |
| 08/19/2023 08/19/23 | Under Contract | -- | -- | -- | |
| 08/08/2023 08/08/23 | Price Changed | $2,245 | -2.2% | $1 / Sq Ft | |
| 08/04/2023 08/04/23 | Price Changed | $2,295 | -2.1% | $1 / Sq Ft | |
| 07/12/2023 07/12/23 | For Rent | $2,345 | 0.0% | -- | |
| 07/11/2023 07/11/23 | Under Contract | -- | -- | -- | |
| 07/03/2023 07/03/23 | For Rent | $2,345 | +2.0% | -- | |
| 08/27/2022 08/27/22 | Rented | $2,299 | 0.0% | -- | |
| 08/13/2022 08/13/22 | Under Contract | -- | -- | -- | |
| 08/12/2022 08/12/22 | Price Changed | $2,299 | -4.2% | $1 / Sq Ft | |
| 08/04/2022 08/04/22 | Price Changed | $2,399 | 0.0% | $1 / Sq Ft | |
| 07/22/2022 07/22/22 | Price Changed | $2,400 | -4.0% | $1 / Sq Ft | |
| 07/22/2022 07/22/22 | Price Changed | $2,500 | -3.8% | $2 / Sq Ft | |
| 06/30/2022 06/30/22 | For Rent | $2,600 | 0.0% | -- | |
| 06/27/2022 06/27/22 | Off Market | $2,600 | -- | -- | |
| 06/07/2022 06/07/22 | For Rent | $2,600 | +31.6% | -- | |
| 09/01/2020 09/01/20 | Rented | $1,975 | 0.0% | -- | |
| 08/04/2020 08/04/20 | Under Contract | -- | -- | -- | |
| 07/24/2020 07/24/20 | Price Changed | $1,975 | -6.0% | $1 / Sq Ft | |
| 07/13/2020 07/13/20 | For Rent | $2,100 | +7.7% | -- | |
| 06/28/2019 06/28/19 | Rented | $1,950 | 0.0% | -- | |
| 06/18/2019 06/18/19 | Under Contract | -- | -- | -- | |
| 05/09/2019 05/09/19 | For Rent | $1,950 | +11.4% | -- | |
| 02/01/2018 02/01/18 | Rented | $1,750 | -1.4% | -- | |
| 01/14/2018 01/14/18 | Under Contract | -- | -- | -- | |
| 12/21/2017 12/21/17 | For Rent | $1,775 | 0.0% | -- | |
| 12/20/2017 12/20/17 | Under Contract | -- | -- | -- | |
| 12/07/2017 12/07/17 | Price Changed | $1,775 | -1.1% | $1 / Sq Ft | |
| 12/06/2017 12/06/17 | Price Changed | $1,795 | -3.0% | $1 / Sq Ft | |
| 12/01/2017 12/01/17 | Price Changed | $1,850 | -2.4% | $1 / Sq Ft | |
| 11/14/2017 11/14/17 | For Rent | $1,895 | 0.0% | -- | |
| 07/19/2013 07/19/13 | Sold | -- | -- | -- | View Prior Sale |
| 05/13/2013 05/13/13 | Pending | -- | -- | -- | |
| 05/01/2013 05/01/13 | For Sale | $220,000 | 0.0% | $139 / Sq Ft | |
| 08/01/2012 08/01/12 | Rented | $1,450 | 0.0% | -- | |
| 07/12/2012 07/12/12 | Under Contract | -- | -- | -- | |
| 07/02/2012 07/02/12 | For Rent | $1,450 | -- | -- |
| Year | Tax Paid | Tax Assessment Tax Assessment Total Assessment is a certain percentage of the fair market value that is determined by local assessors to be the total taxable value of land and additions on the property. | Land | Improvement |
|---|---|---|---|---|
| 2025 | $6,250 | $305,404 | $83,925 | $221,479 |
| 2023 | $6,415 | $354,558 | $83,925 | $270,633 |
| 2022 | $7,266 | $367,899 | $83,925 | $283,974 |
| 2021 | $5,962 | $273,913 | $83,925 | $189,988 |
| 2020 | $6,057 | $282,418 | $83,925 | $198,493 |
| 2018 | $5,573 | $251,706 | $67,140 | $212,340 |
| 2017 | $5,103 | $228,824 | $27,975 | $200,849 |
| 2016 | $5,153 | $231,081 | $27,975 | $203,106 |
| 2015 | $4,245 | $215,465 | $27,975 | $201,231 |
| 2014 | $4,245 | $195,877 | $27,975 | $167,902 |
B
Landlord's Agent in 2025
Bryan Lewright
TexCen Realty
(512) 240-2649
2 Total Sales

Tenant's Agent in 2025
Ally Taylor
Greenwood Residential
(904) 610-5095
9 Total Sales
L
Seller's Agent in 2023
La Donna Keesee
Pink Horizon Realty PLLC
(512) 222-9476
11 Total Sales
Buyer's Agent in 2023
Teresa Carpenter
Resident Realty, LTD.
(512) 970-0871
19 Total Sales
Buyer's Agent in 2022
Nathalia Gulotta
All City Real Estate Ltd. Co
(512) 661-1217
49 Total Sales
A
Buyer's Agent in 2020
Alonzo Perez
Tree Realty, LLC
(512) 550-7088
6 Total Sales
Source: Unlock MLS (Austin Board of REALTORS®)
MLS Number: 7383271
APN: 553778
Disclaimer: Certain information contained herein is derived from information provided by parties other than Homes.com. All information provided is deemed reliable, but is not guaranteed to be accurate and should be independently verified.
![]() Based on information from the Austin Board of REALTORS® (alternatively, from ACTRIS). Neither the Board nor ACTRIS guarantees or is in any way responsible for its accuracy. All data is provided “AS IS” and with all faults. Data maintained by the Board or ACTRIS may not reflect all real estate activity in the market.
Based on information from the Austin Board of REALTORS® (alternatively, from ACTRIS). Neither the Board nor ACTRIS guarantees or is in any way responsible for its accuracy. All data is provided “AS IS” and with all faults. Data maintained by the Board or ACTRIS may not reflect all real estate activity in the market.
Information being provided is for consumers’ personal, non-commercial use and may not be used for any purpose other than to identify prospective properties consumers may be interested in purchasing. All data is obtained from various sources and may not have been verified by broker or MLS GRID. Supplied Open House Information is subject to change without notice. All information should be independently reviewed and verified for accuracy. Properties may or may not be listed by the office/agent presenting the information. Some IDX listings have been excluded from this website.
Based on information submitted to the MLS GRID
Ask me questions while you tour the home.