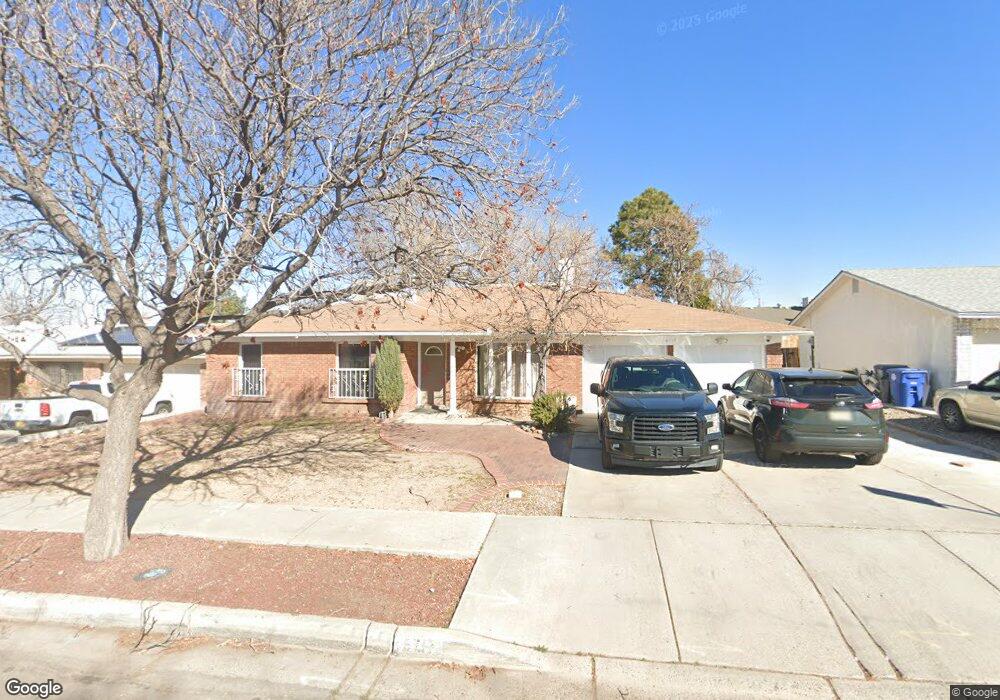
6717 Hensch Ave NE Albuquerque, NM 87109
Bear Canyon NeighborhoodEstimated Value: $384,000 - $457,000
4
Beds
2
Baths
2,100
Sq Ft
$197/Sq Ft
Est. Value
About This Home
This home is located at 6717 Hensch Ave NE, Albuquerque, NM 87109 and is currently estimated at $414,599, approximately $197 per square foot. 6717 Hensch Ave NE is a home located in Bernalillo County with nearby schools including Arroyo Del Oso Elementary School, Cleveland Middle School, and Del Norte High School.
Ownership History
Date
Name
Owned For
Owner Type
Purchase Details
Closed on
Apr 21, 2003
Sold by
Fletcher William James
Bought by
Fletcher William James and Fletcher Regina
Current Estimated Value
Purchase Details
Closed on
Nov 8, 1999
Sold by
Geiser Annette M
Bought by
Fletcher William James and Fletcher Regina F
Home Financials for this Owner
Home Financials are based on the most recent Mortgage that was taken out on this home.
Original Mortgage
$120,000
Outstanding Balance
$42,195
Interest Rate
9.99%
Estimated Equity
$372,404
Purchase Details
Closed on
Apr 8, 1999
Sold by
Huebner Walter F and Huebner Jeanne M
Bought by
Geiser Annette M
Home Financials for this Owner
Home Financials are based on the most recent Mortgage that was taken out on this home.
Original Mortgage
$146,300
Interest Rate
6.89%
Create a Home Valuation Report for This Property
The Home Valuation Report is an in-depth analysis detailing your home's value as well as a comparison with similar homes in the area
Home Values in the Area
Average Home Value in this Area
Purchase History
| Date | Buyer | Sale Price | Title Company |
|---|---|---|---|
| Fletcher William James | -- | Albuquerque Title Co | |
| Fletcher William James | -- | Rio Grande Title Company Inc | |
| Geiser Annette M | -- | Rio Grande Title Company Inc |
Source: Public Records
Mortgage History
| Date | Status | Borrower | Loan Amount |
|---|---|---|---|
| Open | Fletcher William James | $120,000 | |
| Previous Owner | Geiser Annette M | $146,300 |
Source: Public Records
Tax History Compared to Growth
Tax History
| Year | Tax Paid | Tax Assessment Tax Assessment Total Assessment is a certain percentage of the fair market value that is determined by local assessors to be the total taxable value of land and additions on the property. | Land | Improvement |
|---|---|---|---|---|
| 2025 | $2,795 | $78,543 | $17,750 | $60,793 |
| 2024 | $2,795 | $76,255 | $17,233 | $59,022 |
| 2023 | $2,736 | $74,035 | $16,731 | $57,304 |
| 2022 | $2,632 | $71,879 | $16,244 | $55,635 |
| 2021 | $2,531 | $69,786 | $15,771 | $54,015 |
| 2020 | $2,477 | $67,753 | $15,312 | $52,441 |
| 2019 | $2,392 | $65,780 | $14,866 | $50,914 |
| 2018 | $2,295 | $65,780 | $14,866 | $50,914 |
| 2017 | $2,212 | $63,864 | $14,433 | $49,431 |
| 2016 | $2,136 | $60,199 | $13,605 | $46,594 |
| 2015 | $58,446 | $58,446 | $13,209 | $45,237 |
| 2014 | $5,317 | $56,744 | $12,824 | $43,920 |
| 2013 | -- | $55,092 | $12,451 | $42,641 |
Source: Public Records
Map
Nearby Homes
- 6700 Esther Ave NE
- 6800 Esther Ave NE
- 6904 Esther Ave NE
- 6800 Orphelia Ave NE
- 6116 Dungan St NE
- 5813 Elmwood Dr NE
- 6221 Truchas Dr NE
- 6900 Marilyn Ave NE
- 66 Calle de La Noche NE
- 51 Calle San Blas NE
- 49 Calle San Blas NE
- 6917 Marilyn Ave NE
- 7428 Gila Rd NE
- 6432 Truchas Dr NE
- 20 Plaza Olas Altos NE
- 106 Calle Playa Del Sol NE
- 6909 Welton Dr NE
- 6505 Mckinney Dr NE
- 6012 Torreon Dr NE
- 6101 Quemado Dr NE
- 6713 Hensch Ave NE
- 0 Gila Rd at Parque Unit 870202
- 0 Gila Rd
- 6721 Hensch Ave NE
- 6716 Esther Ave NE
- 6712 Esther Ave NE
- 6720 Esther Ave NE
- 6709 Hensch Ave NE
- 6708 Esther Ave NE
- 6716 Hensch Ave NE
- 6712 Hensch Ave NE
- 6720 Hensch Ave NE
- 6705 Hensch Ave NE
- 6704 Esther Ave NE
- 6801 Hensch Ave NE
- 6708 Hensch Ave NE
- 6713 Esther Ave NE
- 6717 Esther Ave NE
- 6721 Esther Ave NE
- 6805 Hensch Ave NE