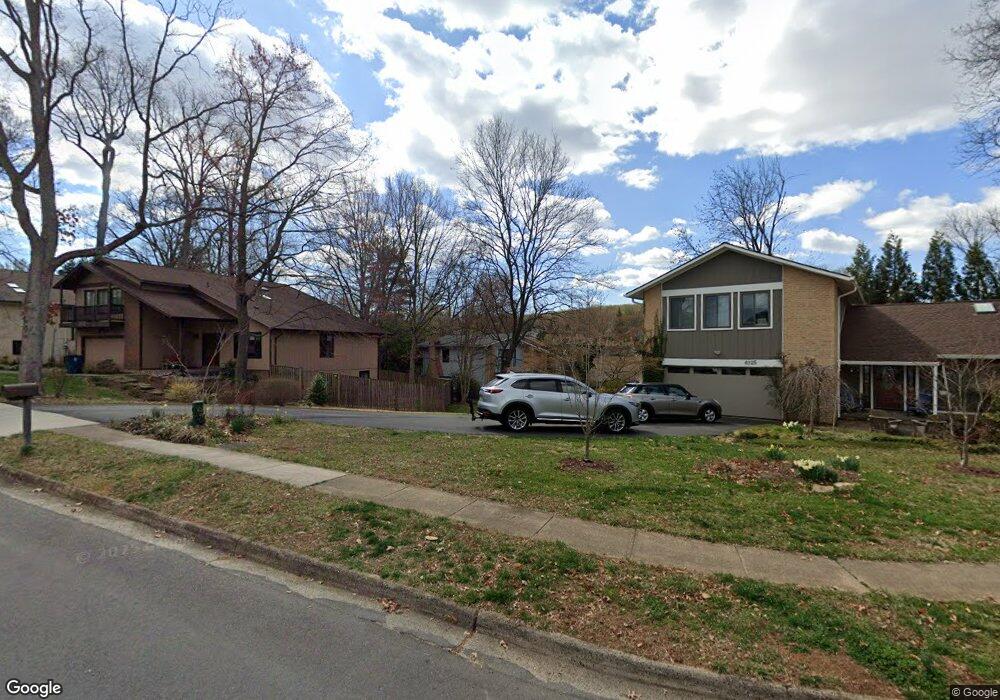
6717 Pine Creek Ct McLean, VA 22101
Estimated Value: $1,303,174 - $1,419,000
4
Beds
4
Baths
2,355
Sq Ft
$578/Sq Ft
Est. Value
About This Home
This home is located at 6717 Pine Creek Ct, McLean, VA 22101 and is currently estimated at $1,361,794, approximately $578 per square foot. 6717 Pine Creek Ct is a home located in Fairfax County with nearby schools including Kent Gardens Elementary School, Longfellow Middle School, and McLean High School.
Ownership History
Date
Name
Owned For
Owner Type
Purchase Details
Closed on
Jun 6, 2011
Sold by
Lin Emily Y and Torng Gwo W
Bought by
Weinstock Herschel
Current Estimated Value
Home Financials for this Owner
Home Financials are based on the most recent Mortgage that was taken out on this home.
Original Mortgage
$710,775
Outstanding Balance
$495,023
Interest Rate
4.85%
Mortgage Type
VA
Estimated Equity
$866,771
Purchase Details
Closed on
Jul 31, 2001
Sold by
Rockelli Patrick M
Bought by
Lin Emily Y
Home Financials for this Owner
Home Financials are based on the most recent Mortgage that was taken out on this home.
Original Mortgage
$392,000
Interest Rate
7.14%
Mortgage Type
Purchase Money Mortgage
Purchase Details
Closed on
Aug 28, 2000
Sold by
Wilson Jame Sh
Bought by
Rockelli Patrick M
Home Financials for this Owner
Home Financials are based on the most recent Mortgage that was taken out on this home.
Original Mortgage
$332,000
Interest Rate
8.06%
Mortgage Type
Purchase Money Mortgage
Create a Home Valuation Report for This Property
The Home Valuation Report is an in-depth analysis detailing your home's value as well as a comparison with similar homes in the area
Home Values in the Area
Average Home Value in this Area
Purchase History
| Date | Buyer | Sale Price | Title Company |
|---|---|---|---|
| Weinstock Herschel | $780,000 | -- | |
| Lin Emily Y | $490,000 | -- | |
| Rockelli Patrick M | $415,000 | -- |
Source: Public Records
Mortgage History
| Date | Status | Borrower | Loan Amount |
|---|---|---|---|
| Open | Weinstock Herschel | $710,775 | |
| Previous Owner | Lin Emily Y | $392,000 | |
| Previous Owner | Rockelli Patrick M | $332,000 |
Source: Public Records
Tax History
| Year | Tax Paid | Tax Assessment Tax Assessment Total Assessment is a certain percentage of the fair market value that is determined by local assessors to be the total taxable value of land and additions on the property. | Land | Improvement |
|---|---|---|---|---|
| 2025 | $2,615 | $1,183,310 | $544,000 | $639,310 |
| 2024 | $13,108 | $1,109,470 | $494,000 | $615,470 |
| 2023 | $12,074 | $1,048,580 | $494,000 | $554,580 |
| 2022 | $11,183 | $958,640 | $439,000 | $519,640 |
| 2021 | $10,369 | $866,580 | $425,000 | $441,580 |
| 2020 | $10,171 | $843,040 | $425,000 | $418,040 |
| 2019 | $9,942 | $824,070 | $425,000 | $399,070 |
| 2018 | $9,477 | $824,070 | $425,000 | $399,070 |
| 2017 | $9,971 | $842,150 | $425,000 | $417,150 |
| 2016 | $9,175 | $776,520 | $423,000 | $353,520 |
Source: Public Records
Map
Nearby Homes
- 1935 Foxhall Rd
- 1955 Kirby Rd
- 6620 Rosecroft Place
- 1904 Lamson Place
- 6607 Midhill Place
- 6739 Darrells Grant Place
- 6610 Quinten St
- 6816 Dean Dr
- 6975 Idylwood Rd
- 6817 Stockwell Manor Dr
- 6545 Placid St
- 6804 Montour Dr
- 6621 Haycock Rd
- 6506 Chesterfield Ave
- 6539 Fairlawn Dr
- 6930 Southridge Dr
- 7107 Penguin Place
- 1715 Maxwell Ct
- 2107 Greenwich St
- 1712 Dalewood Place
- 6715 Pine Creek Ct
- 6723 Pine Creek Ct
- 6711 Pine Creek Ct
- 6721 Pine Creek Ct
- 6725 Pine Creek Ct
- 6709 Pine Creek Ct
- 6713 Pine Creek Ct
- 6727 Pine Creek Ct
- 6707 Pine Creek Ct
- 6705 Pine Creek Ct
- 6708 Pine Creek Ct
- 6720 Pine Creek Ct
- 1932 Poole Ln
- 6729 Pine Creek Ct
- 6703 Pine Creek Ct
- 6724 Pine Creek Ct
- 6682 Avignon Blvd
- 6684 Avignon Blvd
- 6680 Avignon Blvd
- 1931 Poole Ln
Your Personal Tour Guide
Ask me questions while you tour the home.