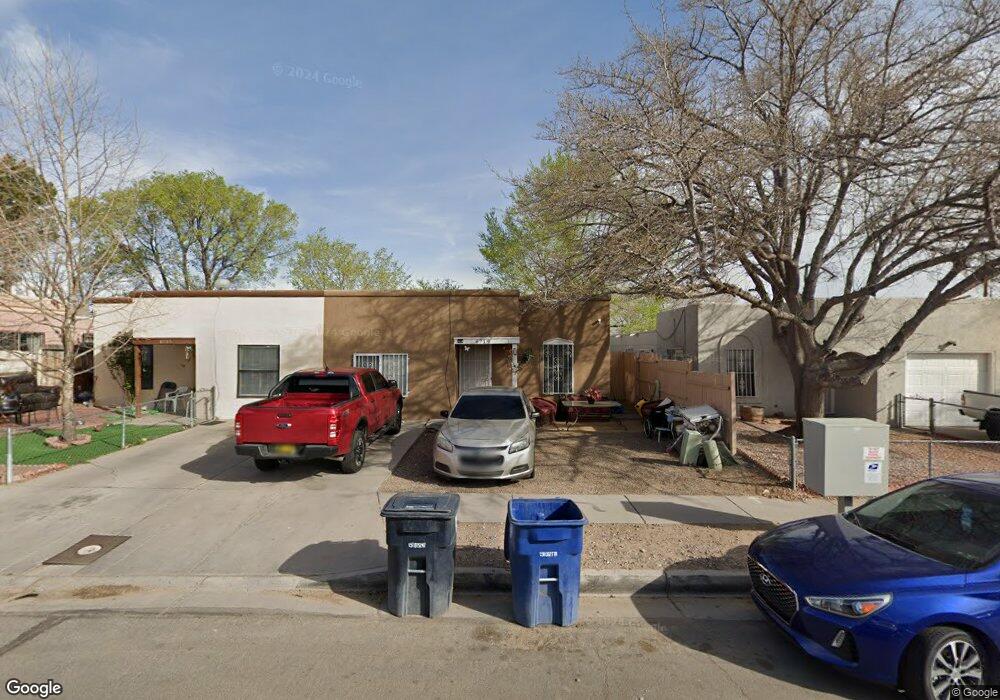
6719 Ivy Place SW Albuquerque, NM 87121
Southwest Heights NeighborhoodEstimated Value: $190,000 - $234,832
2
Beds
2
Baths
1,236
Sq Ft
$179/Sq Ft
Est. Value
About This Home
This home is located at 6719 Ivy Place SW, Albuquerque, NM 87121 and is currently estimated at $221,208, approximately $178 per square foot. 6719 Ivy Place SW is a home located in Bernalillo County with nearby schools including Alamosa Elementary School, Truman Middle School, and West Mesa High School.
Ownership History
Date
Name
Owned For
Owner Type
Purchase Details
Closed on
Jan 24, 2022
Sold by
Pat Valdez
Bought by
Pat Valdez Trust
Current Estimated Value
Purchase Details
Closed on
Mar 21, 2020
Sold by
Valdez Pat
Bought by
Garcia Arturo and Garcia Alejandra
Home Financials for this Owner
Home Financials are based on the most recent Mortgage that was taken out on this home.
Original Mortgage
$100,000
Interest Rate
3.4%
Mortgage Type
Land Contract Argmt. Of Sale
Purchase Details
Closed on
Jan 30, 2015
Sold by
Valdez Rebecca Jenkins
Bought by
Valdez Pat
Purchase Details
Closed on
Apr 29, 2003
Sold by
Deutsche Bank National Trust Co
Bought by
Valdez Pat
Home Financials for this Owner
Home Financials are based on the most recent Mortgage that was taken out on this home.
Original Mortgage
$54,375
Interest Rate
5.74%
Mortgage Type
Purchase Money Mortgage
Purchase Details
Closed on
Aug 5, 1999
Sold by
Valdez Pat
Bought by
Valdez Pat and Jenkins Valdez Rebecca
Create a Home Valuation Report for This Property
The Home Valuation Report is an in-depth analysis detailing your home's value as well as a comparison with similar homes in the area
Home Values in the Area
Average Home Value in this Area
Purchase History
| Date | Buyer | Sale Price | Title Company |
|---|---|---|---|
| Pat Valdez Trust | -- | None Listed On Document | |
| Garcia Arturo | -- | None Listed On Document | |
| Garcia Arturo | $100,000 | None Available | |
| Valdez Pat | -- | None Available | |
| Valdez Pat | -- | Stewart Title | |
| Valdez Pat | -- | -- |
Source: Public Records
Mortgage History
| Date | Status | Borrower | Loan Amount |
|---|---|---|---|
| Previous Owner | Garcia Arturo | $100,000 | |
| Previous Owner | Valdez Pat | $54,375 |
Source: Public Records
Tax History Compared to Growth
Tax History
| Year | Tax Paid | Tax Assessment Tax Assessment Total Assessment is a certain percentage of the fair market value that is determined by local assessors to be the total taxable value of land and additions on the property. | Land | Improvement |
|---|---|---|---|---|
| 2025 | $1,454 | $35,486 | $6,752 | $28,734 |
| 2024 | $1,454 | $34,453 | $6,555 | $27,898 |
| 2023 | $3,011 | $33,450 | $6,365 | $27,085 |
| 2022 | $1,381 | $32,476 | $6,179 | $26,297 |
| 2021 | $1,335 | $31,530 | $5,999 | $25,531 |
| 2020 | $819 | $19,093 | $6,752 | $12,341 |
| 2019 | $795 | $18,537 | $6,555 | $11,982 |
| 2018 | $767 | $18,537 | $6,555 | $11,982 |
| 2017 | $743 | $17,998 | $6,365 | $11,633 |
| 2016 | $722 | $16,965 | $5,999 | $10,966 |
| 2015 | $23,597 | $23,597 | $5,999 | $17,598 |
| 2014 | $1,002 | $23,597 | $5,999 | $17,598 |
| 2013 | -- | $23,897 | $5,999 | $17,898 |
Source: Public Records
Map
Nearby Homes
- 6436 Trujillo Rd SW
- 420 69th St SW
- 420 65th St SW
- 5948 Carlos Rey Cir SW
- 6208 Gonzales Rd SW
- 0 Bridge Blvd SW
- 412 63rd St SW
- Payson Plan at Villa De Marcos Gabriel
- Wellton Plan at Estrella at High Range
- Mesquite Plan at Estrella at High Range
- Bisbee Plan at Estrella at High Range
- Somerton Plan at Estrella at High Range
- Bennett Plan at Estrella at High Range
- 1116 Santander St SW
- 220 Flip Ln SW
- 7400 Via Sereno SW
- 618 Dolores Dr SW
- 7535 Via Tranquilo SW
- 7524 Via Belleza SW
- 714 City View Dr SW
- 6723 Ivy Place SW
- 6715 Ivy Place SW
- 6727 Ivy Place SW
- 6709 Ivy Place SW
- 6705 Ivy Place SW
- 6731 Ivy Place SW
- 6701 Ivy Place SW
- 6735 Ivy Place SW
- 6720 Ivy Place SW
- 6724 Ivy Place SW
- 6714 Ivy Place SW
- 6708 Ivy Place SW
- 6739 Ivy Place SW
- 6730 Ivy Place SW
- 6704 Ivy Place SW
- 6734 Ivy Place SW
- 6700 Ivy Place SW
- 6743 Ivy Place SW
- 6738 Ivy Place SW
- 6801 Ivy Place SW